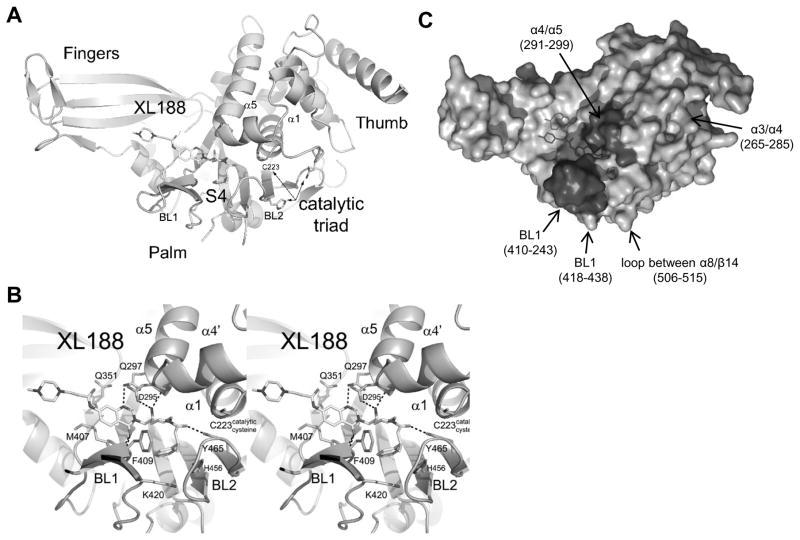
Figure 2. Characterization of XL188 binding to USP7.
A) Ribbon diagram of USP7 with XL188.
B) Stereoview of USP7 (light blue) bound to XL188 (yellow). Hydrogen bonds are indicated by dashed lines.
C) Molecular surface representation of the USP7•XL188 co-structure. Highlighted regions indicate regions of altered HDX in the presence of XL188. Darker colors correspond to significant changes whereas lighter colors correspond to regions with subtle changes.
See also Figure S2, S3, Table S3.

