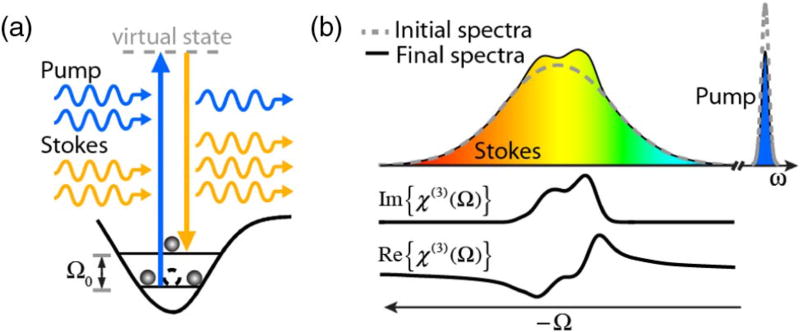
Fig. 1.
(a) SRS energy diagram with a Stokes and pump beam tuned to a sample’s vibrational resonance frequency, Ω0. (b) The interaction between a broadband Stokes beam and a narrow-band pump results in changes in the amplitude and phase of the initial fields. The material’s complex third-order nonlinear susceptibility is also plotted below.

