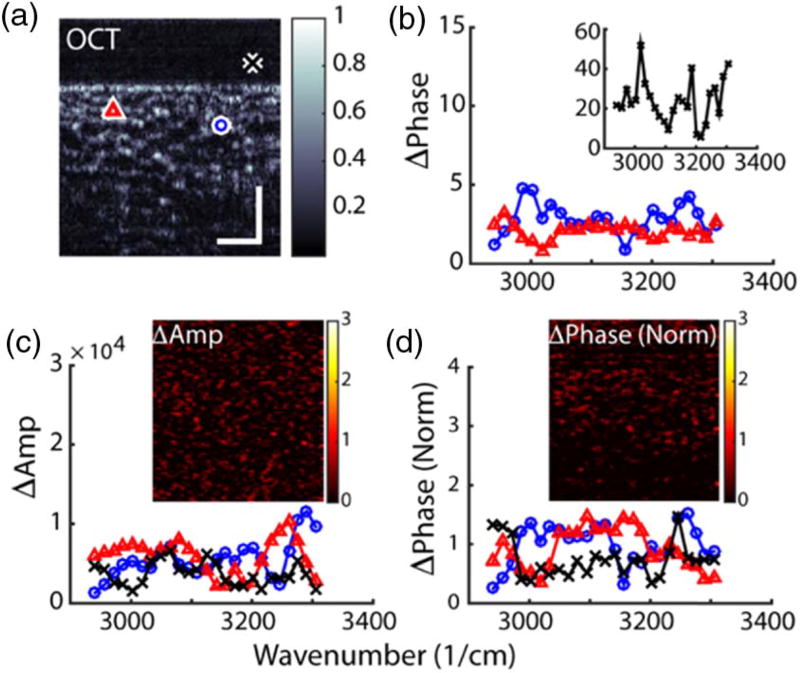
Fig. 5.
SRS-SOCT image of excised human adipose tissue. Stokes and pump frequencies tuned off-resonance with the vibrational modes of lipids. (a) Conventional OCT image. (b),(c) Phase and amplitude spectra from 3 selected points. (d) Normalized phase spectra. Insets show the average molecular response images. Scale bar = 100 µm.

