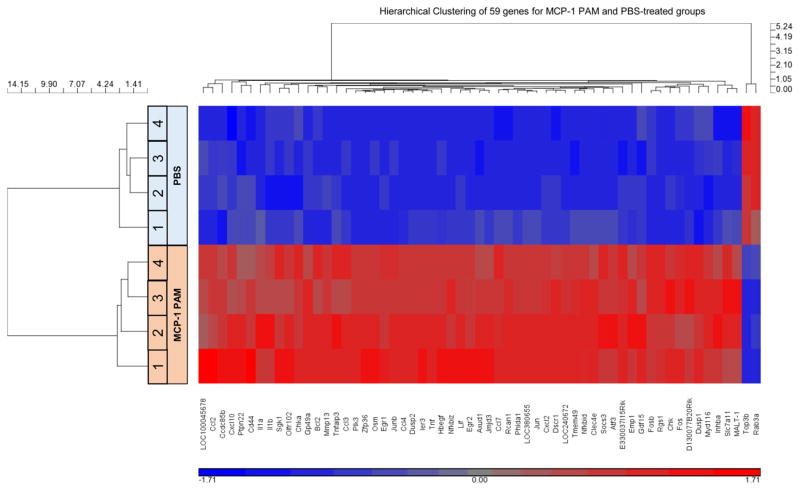
Figure 3.
Evaluation of gene expression changes induced by MCP-1 PAMs. Whole genome microarray analysis was performed on murine monocytes (WEHI.274.1) cultured with MCP-1 PAMs for 1 h and compared to PBS-treated samples on an Illumina BeadChip MouseWG-6 v2.0 expression array (n = 4). Out of 45 281 transcripts analyzed, 59 genes were differentially expressed between MCP-1 PAM vs PBS-treated groups and only Top3b and Rab3a showed decreased expression with FDR corrected p-value, q ≤0.05 and the fold change was ≥1.5.

