Figure 5.
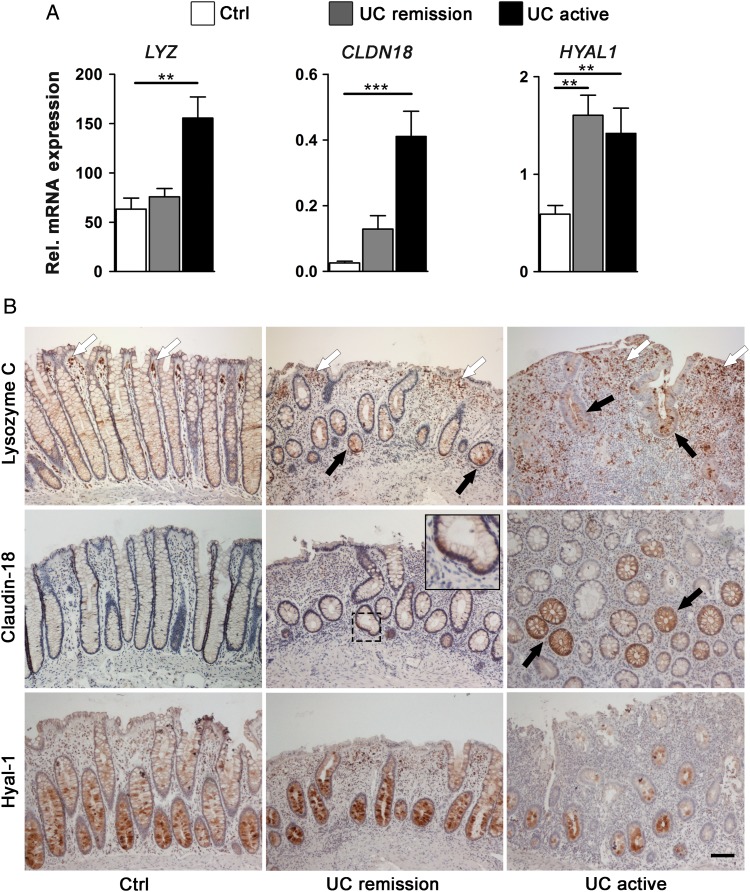
Epithelial cells from involved colonic UC tissue share a panel of upregulated genes with UC epithelial organoid cultures (EpOCs) and differentiated EpOCs. (A) Relative mRNA expression by quantitative real-time PCR of selected genes previously found to be overexpressed in UC compared with control EpOCs. Sigmoid mucosa biopsies from non-IBD controls (n=13) were compared with biopsies from patients with UC in remission (n=24) and with active UC (n=11). Messenger RNA levels are relative to ACTB expression. Mean±SEMs. *p<0.05, **p<0.01, ***p<0.001 by pairwise Wilcoxon test with Bonferroni–Holm correction for multiple testing. (B) Tissue immunohistochemical staining of selected genes differentially expressed in UC compared with control EpOCs. Sigmoid mucosa samples from non-IBD controls were compared with samples from patients with inactive and active UC. Black arrows indicate protein upregulation in UC epithelium compared with the control samples. White arrowheads show the expression of lysozyme C in additional cells in the lamina propria. Scale bar: 100 μm.

