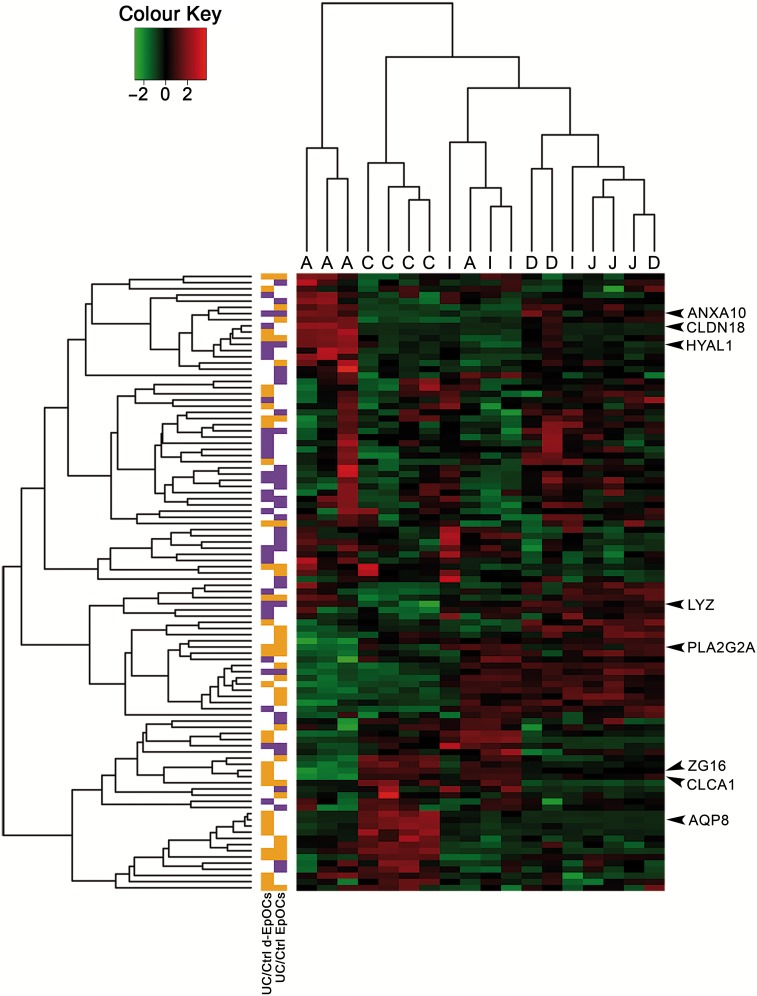
Figure 7.
Epithelial organoid cultures (EpOCs) and differentiated EpOCs (d-EpOCs) from patients with UC adopt expression characteristics of the upper GI tract. Heat map representation of the expression of genes identified in the UC-derived EpOCs shown in figure 3A and B in a set of biopsy samples originating from different segments of the GI tract (C: colon; I: ileum; J: jejunum; D: duodenum; A: antrum). Each row shows one individual probe and each column an experimental sample. High expression levels are shown in red and low expression levels in green. An unsupervised hierarchical cluster method, using a Pearson distance and average linkage method, was applied for both gene and sample classification. In the left columns, genes upregulated or downregulated in UC versus non-IBD control organoid cultures are shown in purple or orange, respectively.

