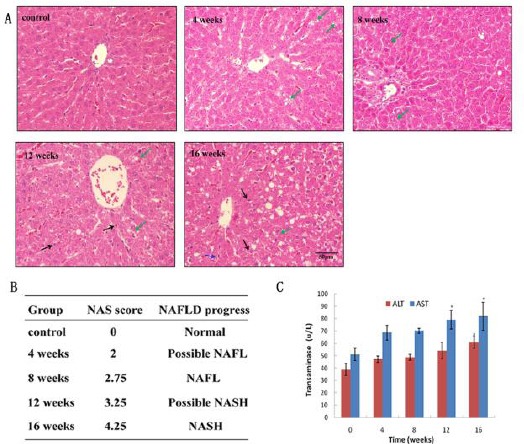
Figure 1.

Progression of NAFLD model as evaluated by HE, NAFLD activity score and transamines activities. A: HE staining of liver tissue paraffin sections prepared from rats administrated with high fat diet for 0, 4, 8, 12, 16 weeks. Green arrow: hepatocellular ballooning; Black arrow: lobular inflammation. B: NAS was evaluated by pathological professionals according to steatosis, lobular inflammation, hepatocellular ballooning and liver fibrosis. C: Determination of alanine aminotranferease (ALT) and aspartate aminotransferase (AST) activities in different groups
