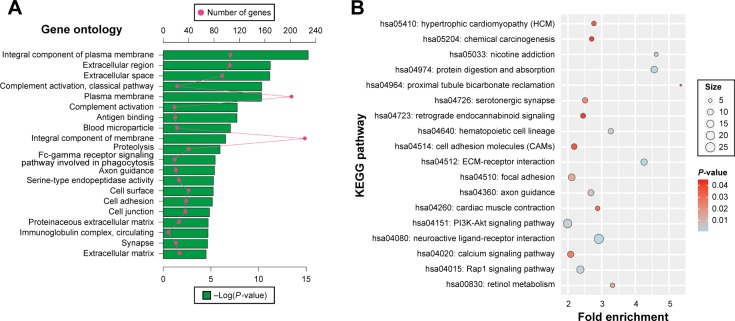
Figure 4.
DAVID enrichment results of upregulated differentially expressed genes.
Notes: (A) The top 20 GO enrichment terms of upregulated differentially expressed genes. (B) The KEGG enrichment pathways of upregulated differentially expressed genes. Red dot in (A) means number of genes; green bar chart in (A) means the -Log(P-value) of the GO term. The “size” in (B) means number of genes.
Abbreviations: DAVID, Database for Annotation, Visualization, and Integrated Discovery; GO, gene ontology; KEGG, Kyoto Encyclopedia of Genes and Genomes; ECM, extracellular matrix.

