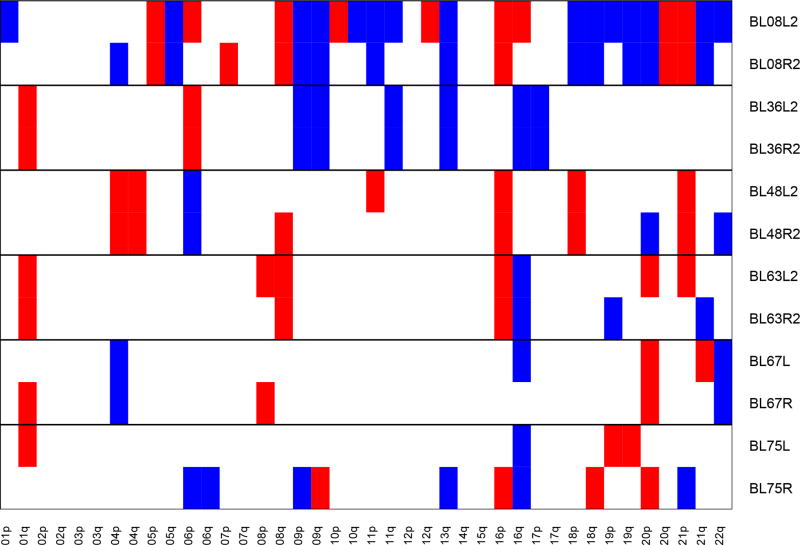
Figure 2. Copy Number Alterations.
Each row represents whole chromosome arm copy number gains (in blue) and losses (in red) for an individual case. Pairs of tumors for all 6 cases with matching mutations are presented. Copy number plots for all cases included in this study are presented in Supplementary Plot 1.

