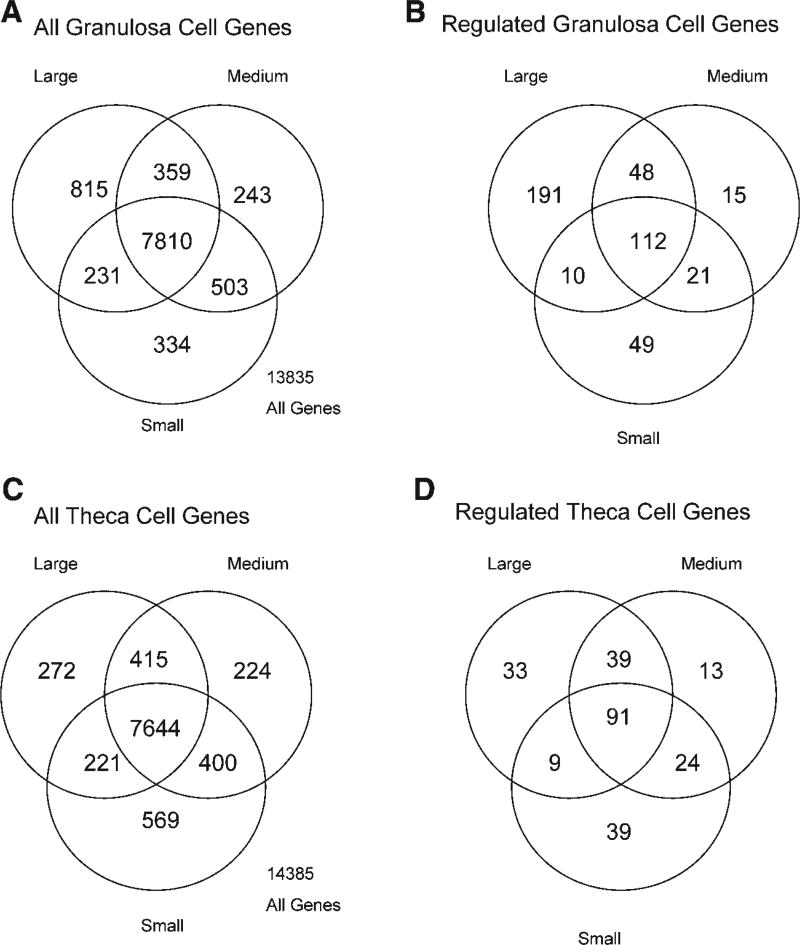
Fig. 1.
The microarray Venn diagram of expressed genes for bovine antral follicle (A,B) granulosa cells and (C,D) theca cells. The total number of expressed granulosa (A) and theca (C) genes are shown for small, medium and large antral follicles. The number of regulated genes (change > 1.5-fold) are shown for granulosa (B) and theca (D) cells from small, medium, and large antral follicles. Overlapping circles represent genes expressed in common.

