
Figure 4. Evaluation of experimental cross-links, secondary structure, and SAXS data with respect to the model.
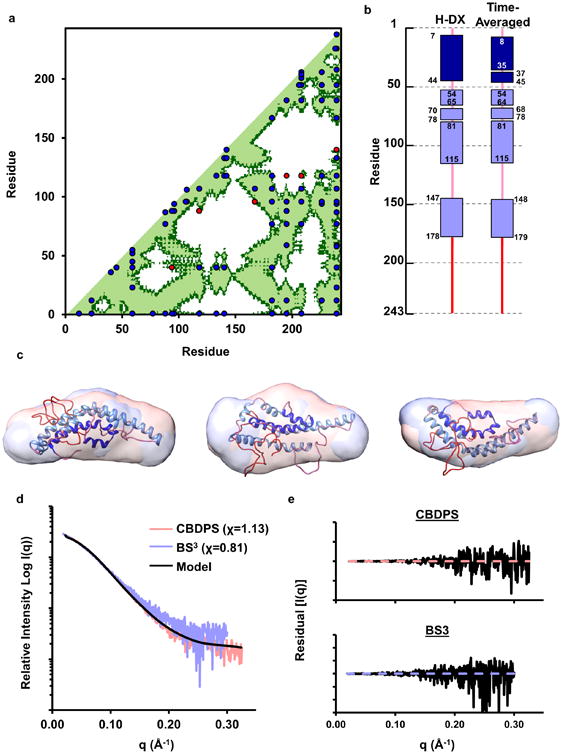
Panel (a): Cross-linking data Supplementary Table 4 containing all published cross-links reported by Melchior, Silva11, Pollard16, and Segrest10. The X and Y axis of the plots indicate the residue number of apoA-I from 1-243. The diagonal line bisects the figure and the bottom/right shows intramolecular interactions. Dark green represents residues within 28 Å (upper limit for alpha-carbons cross-linked with CBDPS or BS3) and light green represents residues within 23 Å (upper limit for alpha-carbons cross-linked with MDA). Blue dots represent experimental cross-links that fall within the upper-limit distance constraint and red dots represent show those that exceed the allowable distance on the time-averaged model. Panel (b): Comparison of the secondary structure reported in the H-DX study by Chetty et. al.12 and the time-averaged model. Rectangles represent α-helical segments and the lines represent random coil. Panel (c): Superposition of the model on molecular envelopes derived from monomeric apoA-I cross-linked with CBDPS and BS3. Panel (d): The theoretical scattering curve of the proposed model (black line) superimposed on the experimental scattering profile of apoA-I cross-linked with CBDPS and BS3. The fit to the respective scattering profiles are shown in parenthesis. Panel (e): The residual plot of the model (black) to experimental scattering data from apoA-I cross-linked with CBDPS and BS3.