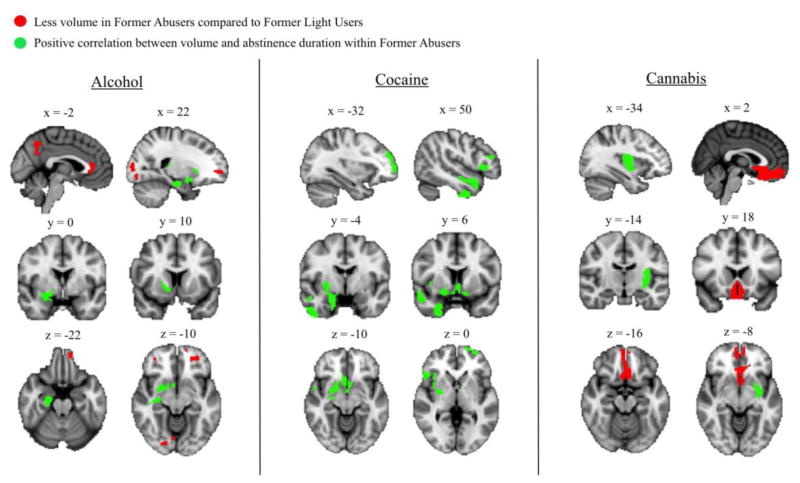
Figure 1.
Results of whole-brain analyses separated by substance set. Red clusters indicate areas where volume is significantly (k>758; p<0.05 corrected) less in former regular users (FRUs) compared to former light users (FLUs) of the substance. Green clusters indicate areas where volume significantly (k>758; p<0.05 corrected) positively correlates with abstinence duration within FRUs of the substance.

