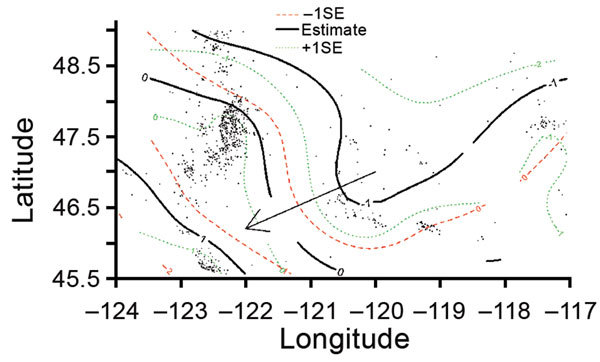
Figure 2.

Risk surface of Escherichia coli O157:H7 lineage IIb relative to lineage Ib using a multinomial generalized additive model and a bivariate thin plate smooth function for longitude and latitude for culture-confirmed human cases reported in Washington, USA, 2005–2014. The black contour lines show the mean effect estimate for lineage IIb relative to Ib as latitude and longitude change. The 0-marked black line indicates no effect. The 1-marked black line indicates greater proportional incidence of lineage IIb toward the southwest corner of the area as compared to lineage Ib (p<0.001). The arrow indicates the general direction of the trend from higher Ib risk to higher IIb risk. Dashed red lines show the effect estimate 1 standard error (SE) below (to the south and west) the mean estimate. Dotted green lines show the effect estimate 1 standard error above (to the north and east) the mean estimate.
