
Figure 1.
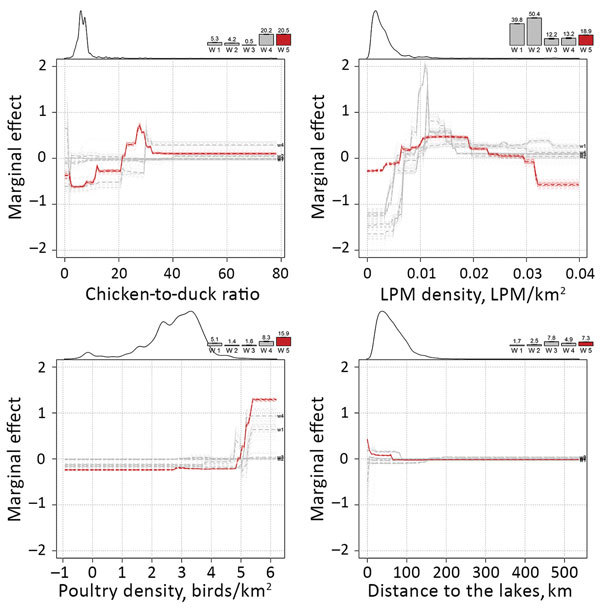
Marginal effect plots of the top 4 predictor variables on the predicted incidence rate of influenza A(H7N9) in China. Change in relative contribution over time is indicated by the bars on the top of each plot, showing the increasing relative contribution of the poultry predictor variables. The smoothed line on the top left part of each plot is indicative of the distribution of each variable.