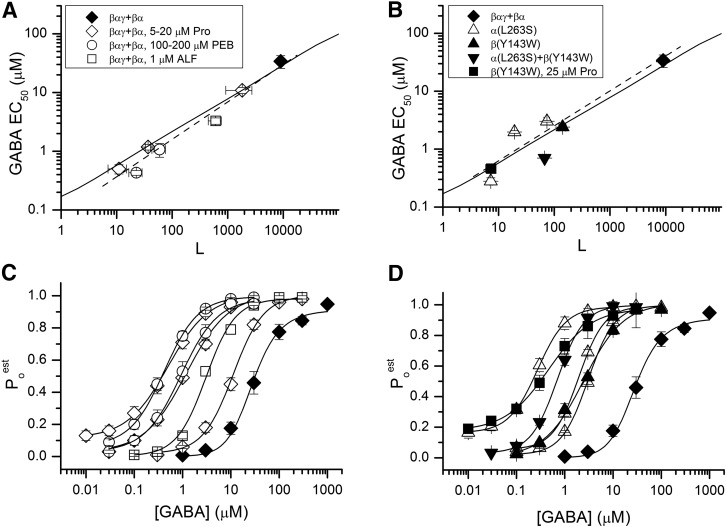
Fig. 4.
Effect of change in L on activation by GABA. The measured EC50 for GABA is plotted logarithmically against the value for L. (A) Data for receptors composed of wild-type concatemers in the absence of any other drug (LWT; ♦) or in the presence of propofol (◇; concentrations of 20, 10, and 5 µM from lower to higher L), pentobarbital (○; 200 and 100 µM), or alfaxalone (□; 1 µM). The symbols show mean values, and the error bars indicate ± 1 S.E.M. The solid line shows the predicted relationship between the EC50 and L using the values estimated for the wild-type: LWT = 9000, NGABA = 2, KGABA = 72 µM, and cGABA = 0.0033. The dashed line shows the linear regression of log(EC50) on log(L) (slope = 0.63 ± 0.05). (B) Data for receptors containing the α1(L263S) mutation (▵; from lower L to higher L mutation is in both constructs, in βαγ, or in βα), the β2(Y143W) mutation (▴; mutation is in both constructs), or the combination of β2(Y143W) in βαγ and α1(L263S) in βα (▾). The plot also shows data for the β(Y143W)αγ+βα receptor in the presence of 25 μM propofol (▪). The solid line shows the predicted relationship using the values from fits of data from the wild-type receptor. The dashed line shows the linear regression of log(EC50) on log(L) (slope = 0.60 ± 0.11). The data are summarized in Table 2. (C and D) Corresponding concentration–response relationships. The symbols show the mean ± S.E.M. The symbols are as in graphs A and B. The curves show fits to the Hill equation incorporating a low-concentration offset. The EC50 values are given in Table 2.

