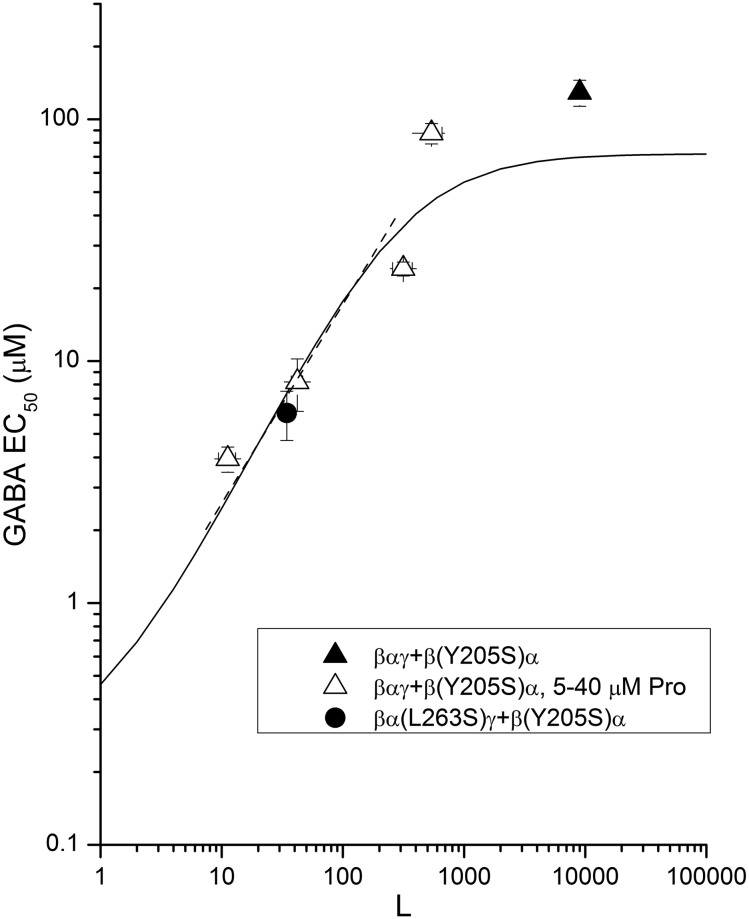
Fig. 5.
Effect of change in NGABA on activation by GABA. The figure shows data for receptors composed of a βαγ concatemer and a β(Y205S)α concatemer in the absence of propofol (▴) and in the presence of four different concentrations of propofol (▵; 40, 20, 10, and 5 µM from lower to higher L). The filled circle shows data from a receptor containing two mutations: βα(L263S)γ and β(Y205S)α. The solid line shows the predicted values for the EC50 assuming that LWT = 9000, KGABA = 72 µM, and cGABA = 0.0033 (unchanged from wild-type receptor values), while NGABA = 1. The dashed line shows the logarithmic regression from the linear region of the predicted line (slope = 0.74 ± 0.1).

