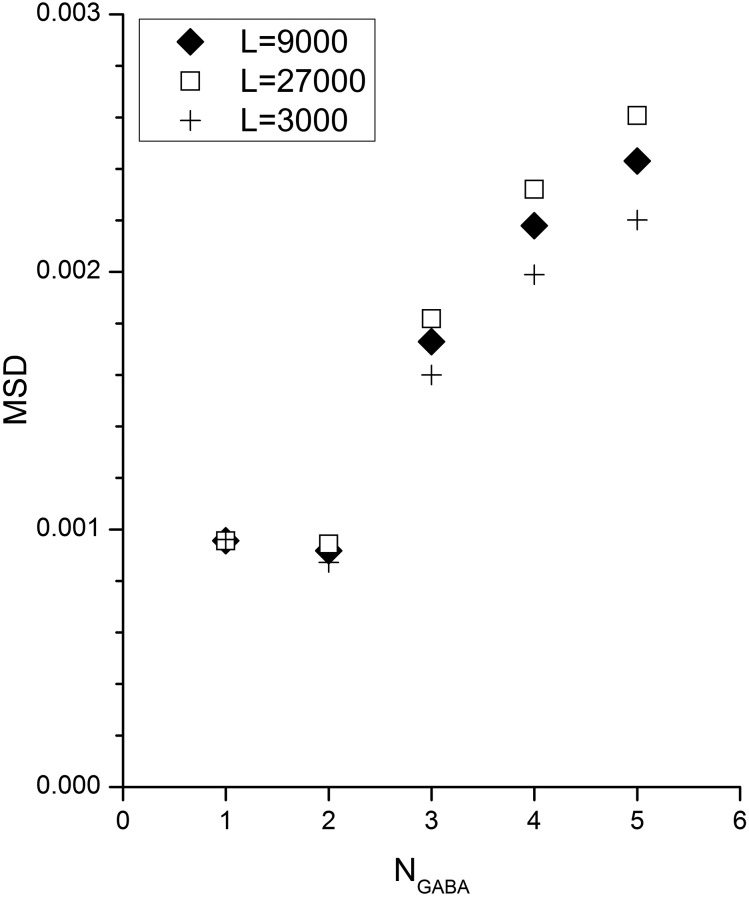
Fig. 6.
Quality of description of concentration–response data with different assumed values for LWT and NGABA. The mean squared differences (MSD) between the predicted and measured concentration–response data are shown for different values of LWT and NGABA. The concentration–response data (see Fig. 3B) were fit with various values for NGABA as indicated on the abscissa and three values for LWT (9000 ♦, 27,000 □, and 3000 +). An F test on the ratio of MSD values indicated that the difference between NGABA = 2 and NGABA = 4 or 5 was marginally statistically significant (P < 0.04 for all L values, uncorrected for multiple comparisons).

