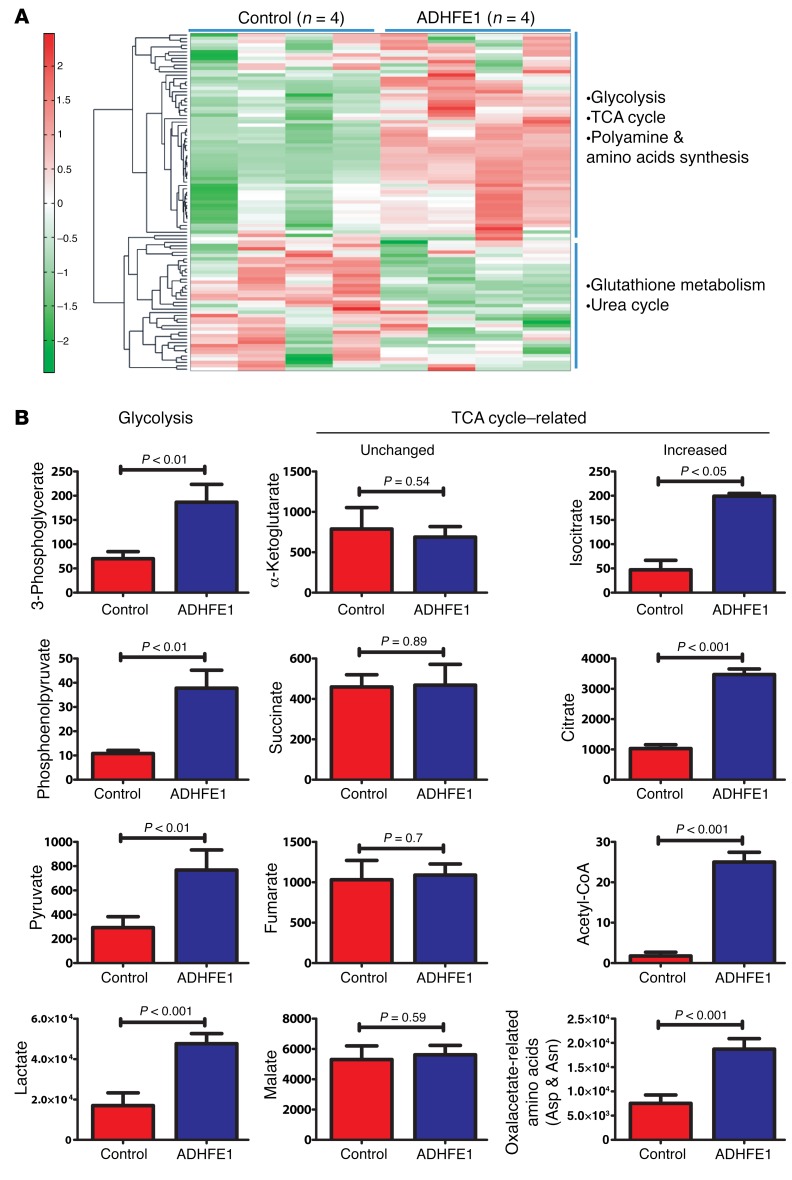
Figure 3. Metabolic reprogramming in MCF12A cells with upregulated ADHFE1.
(A) Heatmap showing increased abundance of glycolysis, tricarboxylic acid (TCA) cycle, polyamines, and amino acid–related metabolites (red) and decreased abundance of glutathione and urea cycle–related metabolites (green) in ADHFE1-expressing MCF12A cells. (B) Increased abundance of glycolytic metabolites and TCA cycle–related metabolites that can be generated by a reductive glutamine metabolism (“increased”) in cells with upregulated ADHFE1. Absolute quantification: metabolite concentrations are reported as pmol/106 cells (mean ± SD, n = 4). Two-sided t test was used to determine statistical significance.

