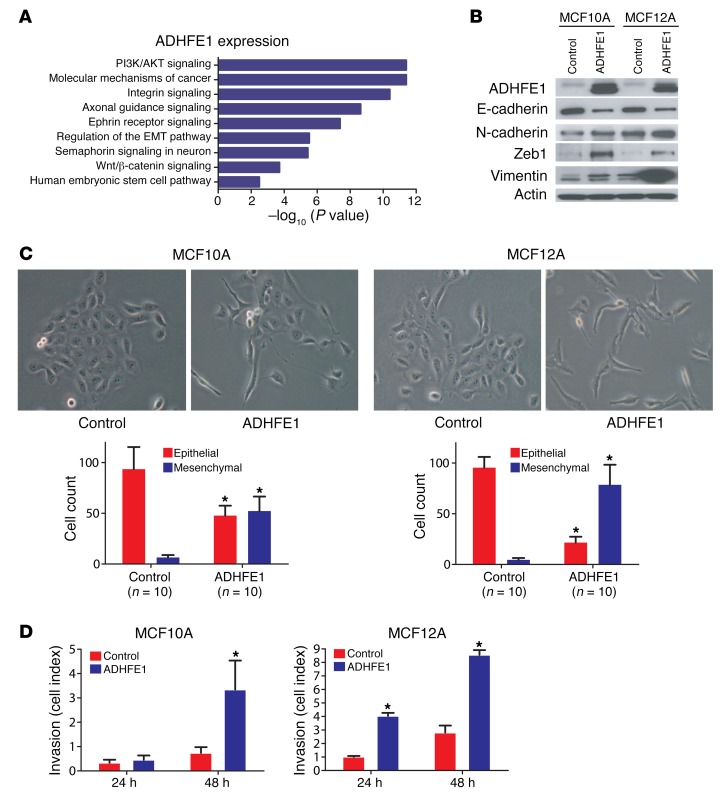
Figure 5. ADHFE1 induces epithelial-to-mesenchymal transition (EMT) and enhances invasion.
(A) Ingenuity pathway analysis showing pathways that are enriched for differently expressed genes comparing MCF12A cells with the ADHFE1 transgene versus vector control cells. Pathways are ranked by P values representing significance of enrichment. (B) Downregulation of E-cadherin and increased expression of mesenchymal markers in MCF10A and MCF12A cells overexpressing ADHFE1. (C) Cells with upregulated ADHFE1 develop a mesenchymal phenotype as shown by loss of cell-cell adhesion and a spindle-shaped morphology. Original magnification, ×200. Graphs below show quantitative analysis of this cell morphology. Shown is the mean ± SD for 10 counted areas (per 100 cells). (D) Increased invasion of cells overexpressing ADHFE1. Invasion was examined using the xCelligence system. Shown is the mean ± SD for triplicate experiments. *P < 0.05, compared with control cells (2-sided t test). Part of Figure 4B is shown in Figure 1D.

