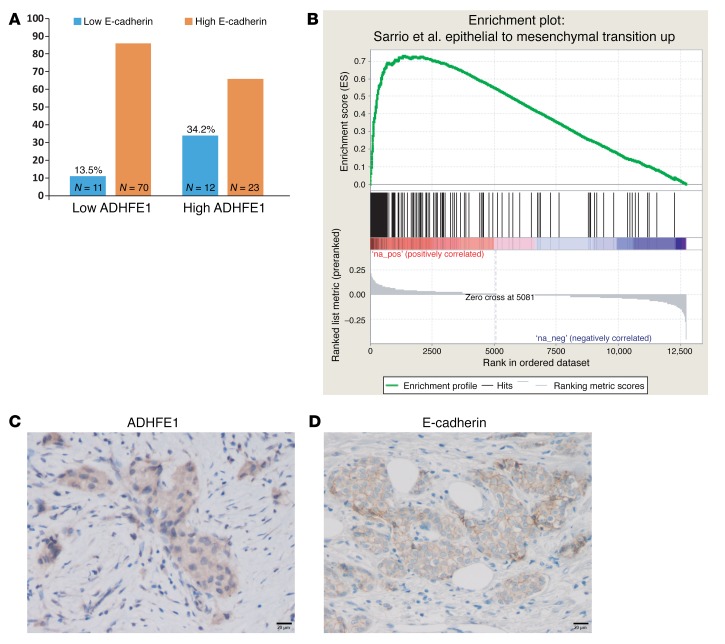
Figure 7. Reduced E-cadherin in tumors with high ADHFE1 and presence of an EMT signature in TCGA breast tumors with ADHFE1 amplifications.
(A) Evaluation of ADHFE1 and E-cadherin expression in 116 human breast tumors using immunohistochemistry. Tumors with high ADHFE1 expression (n = 35) were significantly more likely to show low E-cadherin expression (34.2%) than tumors with low ADHFE1 expression (13.5%). P = 0.02, Fisher’s exact test. (B) Differentially expressed genes between breast tumors with and without ADHFE1 amplifications (reference) were enriched for an EMT signature. The GSEA enrichment score was high (0.7) for upregulated EMT signature genes (black bars) in tumors with amplifications. FDR < 0.001. Forty-five breast tumors in the TCGA database had an ADHFE1 amplification. (C) Immunohistochemistry with representative ADHFE1 expression in a breast tumor. ADHFE1 is seen in the cytoplasm of the tumor epithelium (brown chromogen) and has a granular distribution, consistent with the mitochondrial location of the enzyme. (D) Representative E-cadherin expression in a breast tumor. Shown is staining of the cell membrane that is typical for this protein. Original magnification, ×400 (C and D).

