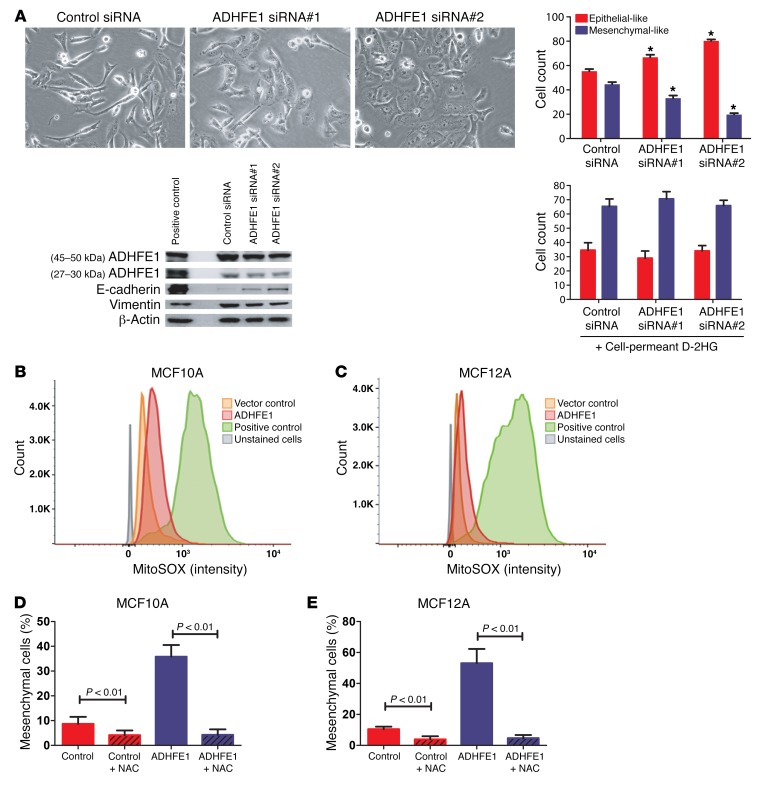
Figure 8. ADHFE1 downregulation promotes mesenchymal-to-epithelial transition (MET) and N-acetylcysteine inhibits ADHFE1-induced EMT.
(A) Increase in epithelial characteristics in MDA-MB-231 cells after downregulation of ADHFE1 with siRNA. Addition of cell-permeant D-2HG inhibits siRNA-induced MET. *P < 0.01 versus control siRNA. Shown is the mean ± SD for 10 counted areas (per 100 cells) and protein expression at day 3 after siRNA transfection. Original magnification, ×200. (B and C) The mitochondrial superoxide indicator, MitoSOX, shows increased superoxide production in MCF10A and MCF12A cells with upregulated ADHFE1. Shown are representative flow cytometry experiments. MCF10A cells, 27.3% ± 19.6% superoxide increase versus vector control (n = 4); MCF12A cells, 48.2% ± 5.5% (n = 4); P < 0.05. (D and E) Inhibition of ADHFE1-induced EMT by N-acetylcysteine (NAC). MCF10A and MCF12A cells were cultured for 3 days. NAC (10 mM) was added 24 hours prior to assessment of EMT. Number of cells with mesenchymal features was counted in 5 representative areas as percentage of all cells. Significance of differences in A, D, and E was determined with a 2-sided t test.

