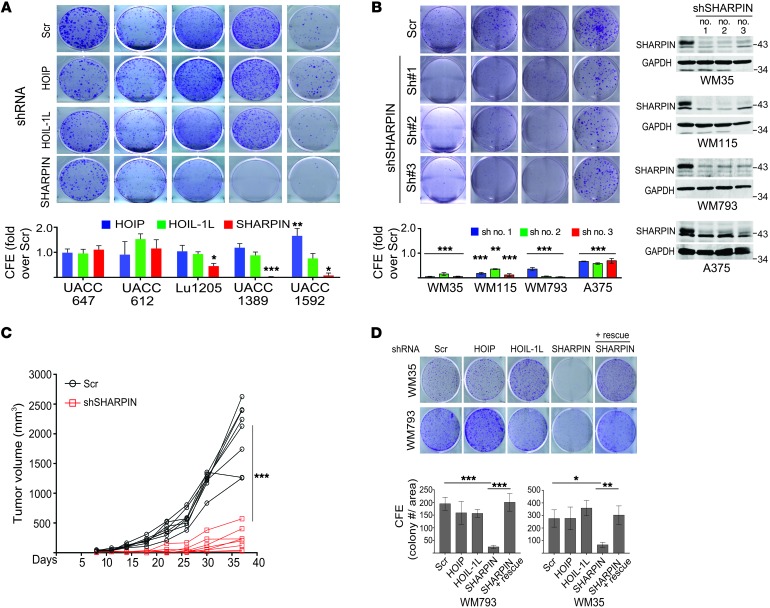
Figure 2. SHARPIN plays a role in melanoma growth.
(A) Colony-forming efficiency (CFE) assay of melanoma cell lines expressing scrambled (Scr) or HOIP-, HOIL-1L–, or SHARPIN-specific shRNA. Cells were seeded at 103/well and incubated for 14 days. Upper panels show representative images on day 14, and lower graph shows quantification of CFE (ImageJ). KD efficiency of each gene was confirmed with immunoblotting (see Supplemental Figure 1D). (B) CFE assay of melanoma cell lines expressing scrambled or SHARPIN-specific shRNAs (nos. 1, 2, and 3). Cells were seeded at 2.5 × 10³/well and analyzed as in D. (C) Growth of WM115 cells (4 × 10⁶ cells) expressing scrambled or SHARPIN-specific shRNA after subcutaneous injection into female nude mice. Tumor volumes were measured at the indicated time points. Data are presented as mean ± SD. n = 8 mice/group. Statistical significance was calculated using 2-way ANOVA. (D) CFE assay of WM793 and WM35 cells treated as indicated in C except that SHARPIN was reexpressed (+ rescue) as indicated. Upper panel shows representative images of colonies on day 14 after seeding at 103/well. Lower graph shows CFE quantification on day 14. All quantitation data are presented as mean ± SD (n = 3). (A, B, D) Statistical significance was calculated using 1-way ANOVA and Dunnett’s test. *P < 0.05; **P < 0.005; ***P < 0.0005 (2-tailed Student’s t test). (A and B) Data are representative of 3 experiments.

