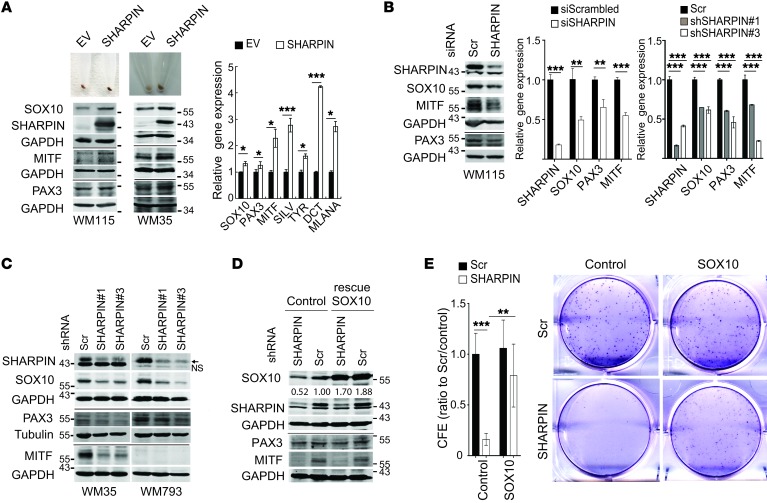
Figure 3. SHARPIN affects melanoma growth and survival through regulation of SOX10, PAX3, and MITF expression.
(A) Pigmentation (upper panels), immunoblot (lower panels), and qPCR (right panel) analysis of MITF and upstream/downstream regulatory proteins in WM115 or WM35 melanoma cells overexpressing SHARPIN or a control empty vector (EV). qPCR data are presented as relative mRNA levels compared with control cells. (B) Immunoblot (left panel) and qPCR (right panels) analysis of WM115 cells expressing scrambled or SHARPIN-specific siRNAs or shRNAs. Statistical significance was calculated using Student’s t test (unpaired, 2 tailed, siRNA) or 1-way ANOVA and Dunnett’s test (shRNA). (C) Immunoblot analysis of WM35, WM793 and WM115 cells expressing scrambled or SHARPIN-specific shRNAs. Arrow and NS indicate SHARPIN and nonspecific bands, respectively. (D) Immunoblot analysis and CFE assay of WM115 melanoma cells expressing scrambled or SHARPIN-specific shRNA and ectopically expressing control or SOX10 (rescue). Middle and right panels show representative images of colonies and quantification of CFE 14 days after cells were seeded at 103/well. CFE (ratio to scrambled/control) was presented as mean ± SD, and statistical significance was calculated using 2-way ANOVA and Tukey’s test (n = 6 from 2 independent experiments). All qPCR data are presented as mean ± SD (n = 3).*P < 0.05; **P < 0.005; ***P < 0.0005 (2-tailed, Student’s t test). (A–D) Data are representative of 2 experiments.

