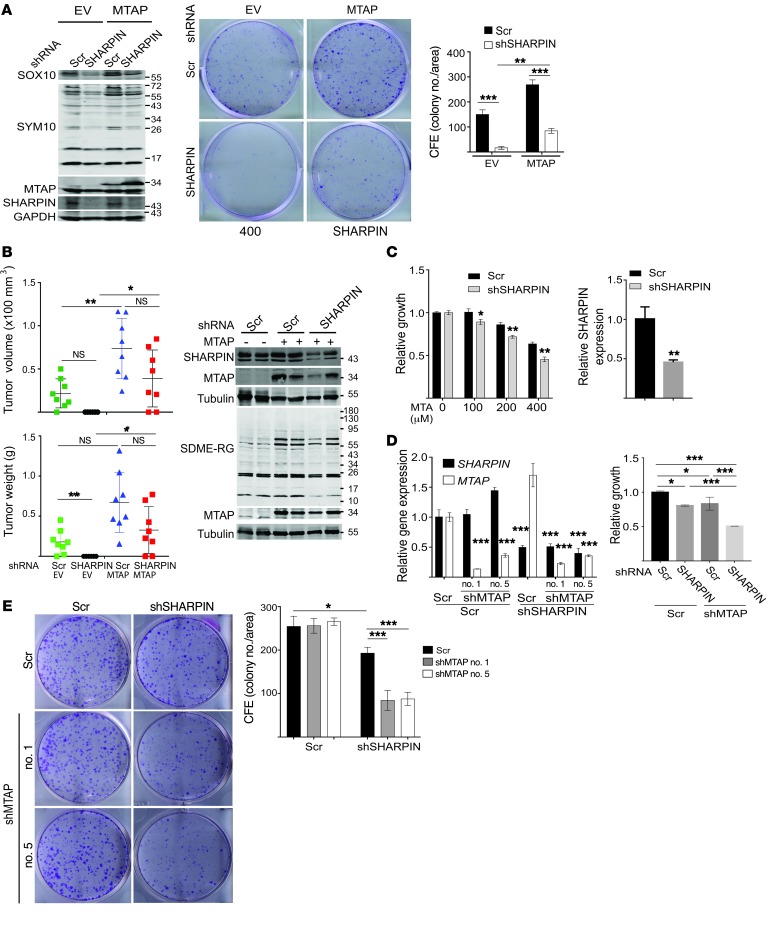
Figure 7. MTAP expression determines sensitivity to SHAPIN-mediated growth inhibition of melanoma.
(A) Immunoblot analysis and CFE assay of WM35 cells stably expressing empty vector or MTAP expression plasmids plus scrambled or SHARPIN-specific shRNA. Cells were seeded at 103/well and colonies were visualized and quantified after 14 days in culture. (B) Growth of WM35 cells (2.0 × 10⁶ cells) injected subcutaneously into female nude mice. Stable WM35 transfectants expressing empty vector or MTAP were subjected to KD with scrambled or SHARPIN-specific shRNA. Tumor volume (upper panel) and weight (lower panel) were measured at the indicated time. Immunoblot analysis (right panel) was performed using representative tumor lysates from each group. Data are presented as mean ± SD (at the end point of experiment). n = 8 mice/group. Two-way ANOVA test (tumor volume) or Welch’s test (tumor weight). (C) Cell growth/viability (ATPlite, left panel) of A375 cells expressing scrambled or SHARPIN shRNA, and then treated with indicated amount of MTA for 5 days. KD efficiency of SHARPIN was analyzed with qPCR (right panels). (D) As in C, qPCR analysis (left) and growth/viability assay (ATPlite, right) of A375 cells expressing shRNAs, scrambled, shSHARPIN, and/or shMTAP. (E) CFE assay of A375 cells expressing scrambled, SHARPIN, or MTAP (nos. 1 and 5) shRNAs. Cells (2.5 × 10³/well) were seeded and cultured for 14 days. Colonies were visualized and quantified (ImageJ). All quantitation data and qPCR data are presented as mean ± SD (n = 3). Statistical significance was calculated using 1-way (D, left) or 2-way (A and B, D, right, E) Tukey’s test. *P < 0.05; **P < 0.05; ***P < 0.0005. (A, C–E) Data represent results from 2 to 3 independent experiments.

