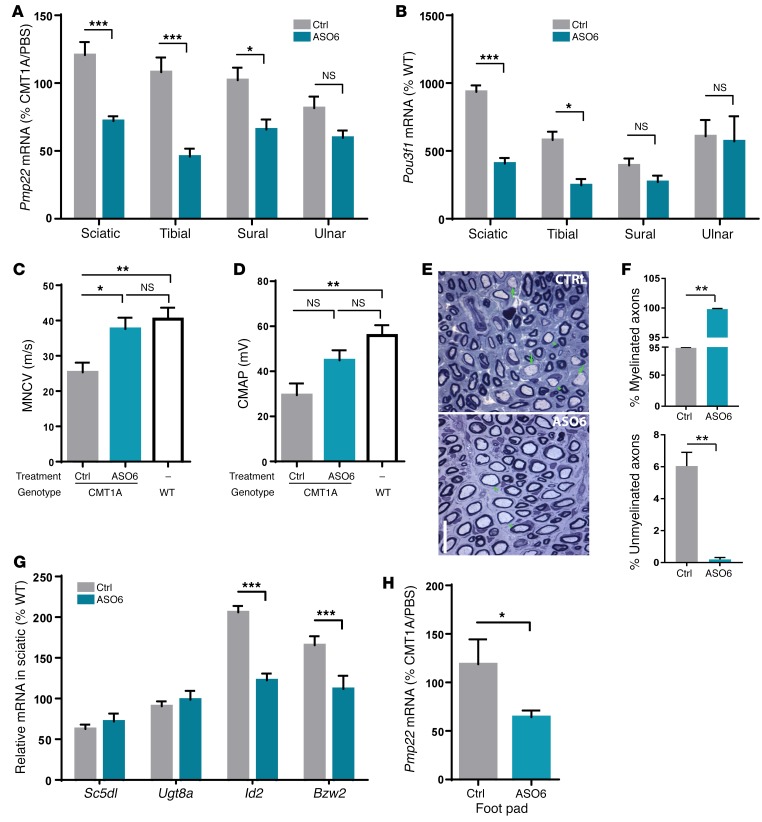
Figure 3. Myelination and electrophysiological improvement after ASO treatment in a rat model of CMT1A.
CMT1A rats were treated weekly for 12 weeks with PBS, control ASO (12.5 mg/kg), or ASO6 (12.5 mg/kg). n = 10 per group. WT littermates treated with PBS were included as control. n = 10 per group. (A) Rat Pmp22 mRNA in various nerves of control and ASO6-treated rats. ASO6-treated group was compared with control group in each nerve using Student’s t test. *P < 0.05; ***P < 0.001. (B) Pou3f1 mRNA in various nerves of control and ASO6-treated rats. PMP22 ASO–treated group was compared with control group in each nerve using Student’s t test. *P < 0.05; ***P < 0.001. (C and D) MNCV and CMAP were measured at 12 weeks following treatment. (E) Representative histological image of cross-sectioned femoral motor nerves of CMT1A rats treated with control or ASO6. Arrows and arrowheads indicate unmyelinated and myelinated axon of greater than 1 micron in diameter, respectively. Scale bar: 5 μm. (F) Quantification of percentage of myelinated and percentage of unmyelinated axons. ASO6-treated group was compared with control group using Student’s t test. **P < 0.01. (G) qRT-PCR confirmation of mRNA expression of lipid biosynthetic (Sc5dl and Ugt8a), myelin inhibitor (Id2), and translational repressor (Bzw2) genes in the sciatic nerve of control vs. ASO6-treated rats. ASO6-treated group was compared with control group in each nerve using Student’s t test. ***P < 0.001. (H) Rat Pmp22 mRNA in footpad following control or ASO6 treatment. ASO6-treated group was compared with control group using Student’s t test. *P < 0.05.

