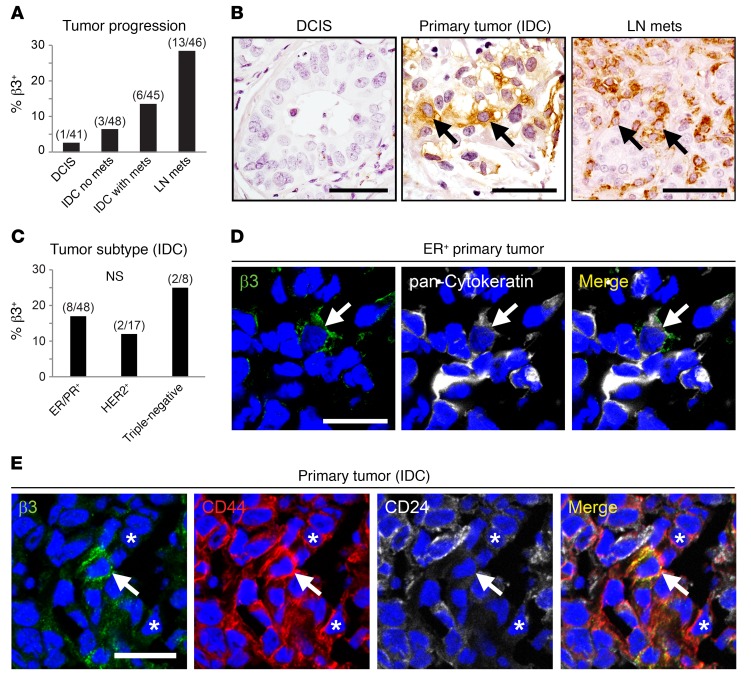
Figure 1. In breast cancer patients’ samples, αvβ3 identifies stem-like cells associated with tumor progression, independent of clinical subtype.
(A–C) Immunohistochemical staining for β3 in breast cancer tissue microarrays representing various stages of disease progression (A and B)and clinical breast cancer subtypes (C). (A) Histogram displaying the percentage of tumors containing β3+ cells at different stages of progression of breast cancer including DCIS, IDC, with or without metastases (mets), and lymph node metastases (LN mets). P = 0.0001, by χ2 test for trend. (B) Representative examples of β3-expressing tumor cells (arrows) are shown for the breast cancer patients’ samples in A. (C) Quantitation of the frequency of β3+ tumors in different clinical breast cancer subtypes, including tumors expressing ER+/PR+ or HER2+ receptors or lacking all 3 (Triple-negative). (A and C) Numbers above each bar indicate the β3+ tumors per total number of tumors for each category. (D and E) Representative examples of immunofluorescence staining for β3 and pan-cytokeratin (D) or CD44 and CD24 (E) in frozen human breast cancer tissue microarrays. Arrows indicate β3+ cells coexpressing cytokeratins (D) or the stem profile CD44+CD24lo (E). Nuclei are stained blue in all panels. Asterisks in E mark CD44+CD24lo cells that lack β3. n = 6/17 (β3+CD44+CD24lo tumors/total). Scale bars: 50 μm (B); 20 μm (D and E). See also Supplemental Figure 1.

