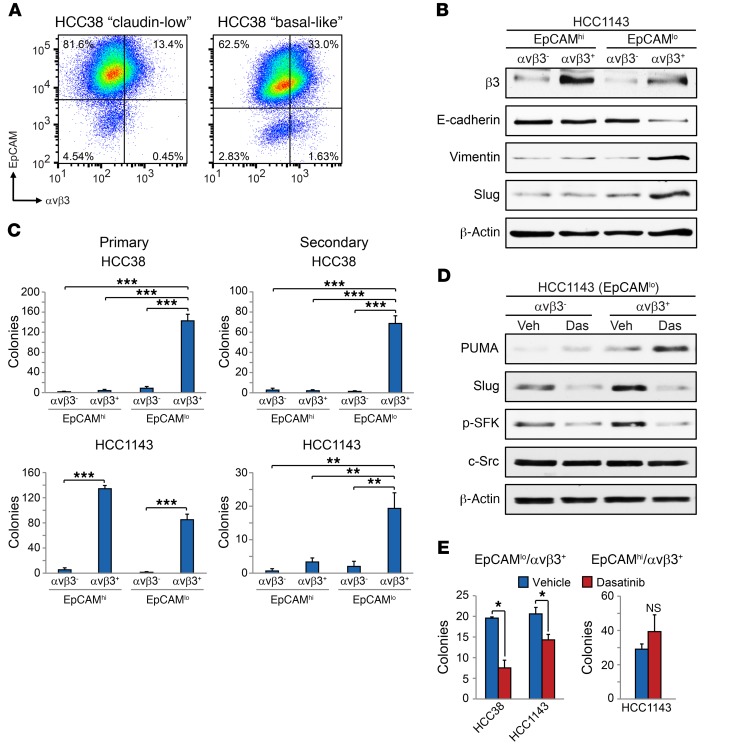
Figure 6. Src inhibition upregulates PUMA and depletes stem-like cells in distinct breast cancer subtypes.
(A) Representative FACS density plots of the HCC38 and HCC1143 breast cancer cell lines showing the live, CD49f+ cells according to their cell-surface EpCAM and αvβ3 expression. (B) Immunoblot of the indicated FACS-sorted cell populations from HCC1143 cells. β-Actin was used as a loading control. (C) Primary and secondary tumorsphere assays in methylcellulose for the indicated sorted cell populations. Shown are the total number of colonies per well. Primary tumorspheres, HCC38; P < 0.0001 for EpCAMloαvβ3+ versus all other cell types, HCC1143; P < 0.0001 for EpCAMhiαvβ3– versus EpCAMhiαvβ3+ and EpCAMloαvβ3– versus EpCAMloαvβ3+. Secondary tumorspheres, HCC38; P < 0.0001 for EpCAMloαvβ3+ versus all other cell types, HCC1143 (EpCAMloαvβ3+); P = 0.0037 (vs. EpCAMhiαvβ3–), P = 0.0094 (vs. EpCAMhiαvβ3+), P = 0.0059 (vs. EpCAMloαvβ3–). Statistical analysis was performed by 1-way ANOVA with Tukey’s multiple comparisons test. n = 3 independent experiments. (D) Western blot analysis of the indicated HCC1143 sorted cells treated with DMSO vehicle or 100 nM dasatinib for 24 hours. β-Actin was used as a loading control. Data shown in A, B, and D are representative of 3 independent experiments. (E) Bar graphs show the number of tumorspheres per field formed in the indicated HCC38 and HCC1143 cell populations after treatment with vehicle (DMSO) or 500 nM dasatinib. The P values for vehicle versus dasatinib are as follows: P = 0.0208 (HCC38; EpCAMloαvβ3+); P = 0.0384 (HCC1143; EpCAMloαvβ3+); P = 0.4060 (HCC1143; EpCAMhiαvβ3+). Statistical analysis was performed by Student’s t test (E). n = 3 independent experiments performed in triplicate. Data in C and E represent the mean ± SEM. *P < 0.05, **P < 0.01, and ***P < 0.001. See also Supplemental Figure 6.

