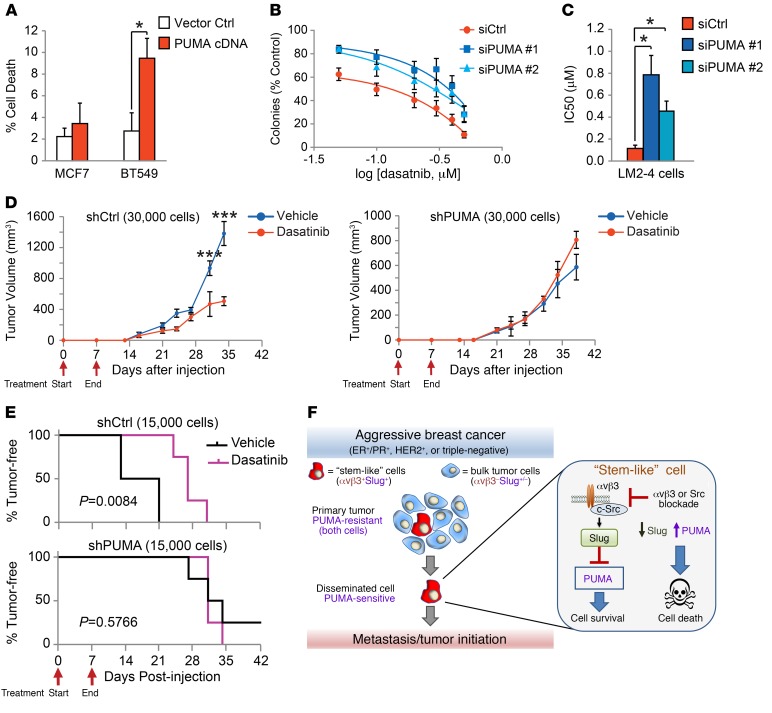
Figure 7. PUMA expression is a critical vulnerability of stem-like cells.
(A) Quantification of cell death by trypan blue staining after transient transfection of MCF7 and BT549 breast cancer cell lines with PUMA cDNA or empty control vector relative to mock-transfected controls. P = 0.0262 (BT549; PUMA cDNA vs. vector control), by Student’s t test. n = 3 independent experiments run in duplicate. (B and C) Dasatinib dose-response experiments with LM2-4 cells transfected with control siRNA or either of 2 different PUMA siRNAs. n = 5 independent experiments performed in duplicate. (B) Curves were fitted by nonlinear regression. (C) IC50 was calculated from the nonlinear regression curves. P = 0.0331 (siCtrl vs. siPUMA no. 1); P = 0.0141 (siCtrl vs. siPUMA no. 2), by 1-way ANOVA with Dunnett’s multiple comparisons test. (D and E) In vivo tumor studies comparing different numbers of shCtrl and shPUMA LM2-4 cells injected orthotopically into adult female mice and treated with 30 mg/kg dasatinib or vehicle (1% citric acid) once daily by oral gavage for the first 7 days after injection. Red arrows indicate the start and end of daily drug treatment. n = 4 mice per group. (D) Graphs display the tumor volume after injection of 30,000 cells. P < 0.0001 (days 31 and 34), by 2-way, repeated-measures ANOVA with Sidak’s multiple comparisons test. (A–D) Data represent the mean ± SEM. *P < 0.05 and ***P < 0.001. (E) Tumor latency after injection of 15,000 cells. P = 0.0084 (shCtrl; vehicle vs. dasatinib); P = 0.5766 (shPUMA; vehicle vs. dasatinib), by log-rank (Mantel-Cox) test. (F) Schematic depicting how PUMA expression driven by αvβ3/Src blockade can target highly vulnerable metastatic and tumor-initiating stem-like breast cancer cells compared with cells in the primary tumor. See also Supplemental Figure 7.

