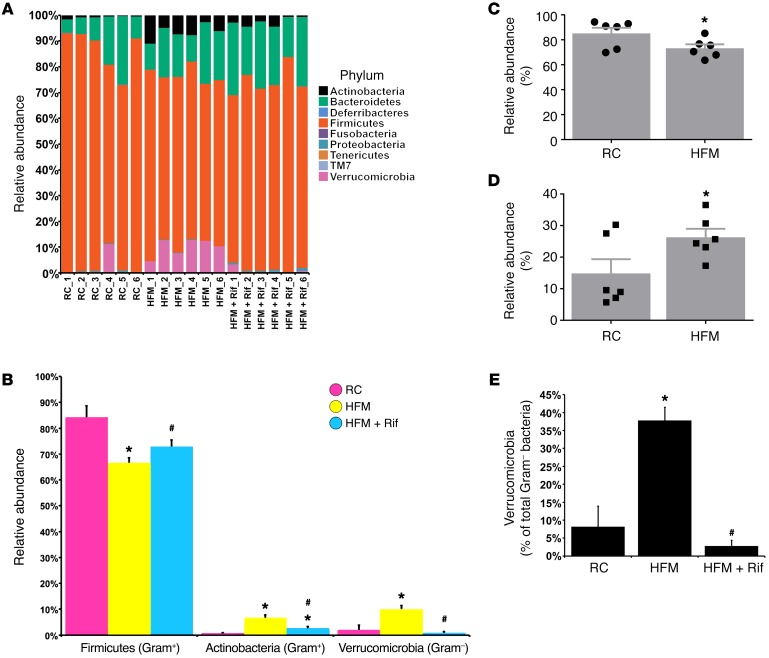
Figure 3. HFM-induced dysbiosis in the colon.
(A) Relative abundance of OTUs classified at the level of phylum. (B) Relative abundance of Firmicutes, Actinobacteria, and Verrucomicrobia. (C) Relative abundance of Gram-positive communities. (D) Relative abundance of Gram-negative communities. (E) Relative abundance of Verrucomicrobia in total Gram-negative bacteria. (n = 6 per group). *P < 0.05 versus RC; #P < 0.05 versus HFM. P values determined by 2-tailed Student’s t test.

