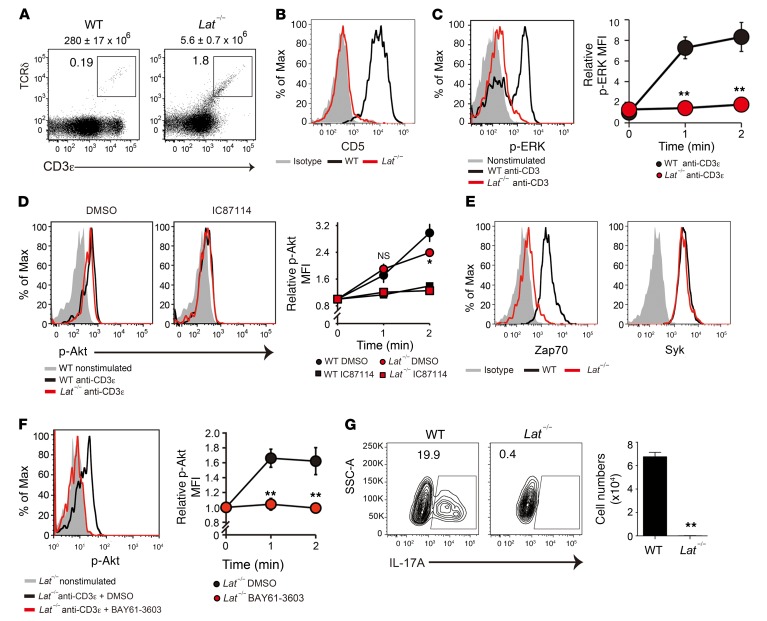
Figure 6. Syk mediates the Lat-independent TCR signal to the PI3K/Akt pathway.
(A) Flow cytometric profiles for CD3ε and TCRδ in total thymocytes from 5-week-old WT and Lat–/– mice. The total number of thymocytes is shown above each flow cytometric plot (n = 3). (B) Flow cytometric analysis of CD5 expression in thymic γδT cells (n = 3). (C) TCR-induced ERK phosphorylation in thymic γδT cells. Graph indicates the MFI relative to the nonstimulated control (n = 3). (D) TCR-induced Akt phosphorylation in thymic γδT cells pretreated or not with IC87114 (10 μM). Graph shows the MFI relative to the nonstimulated control (n = 3). (E) Flow cytometric analysis of Zap70 and Syk expression in thymic γδT cells from 5-week-old WT and Lat–/– mice (n = 3). (F) TCR-induced Akt phosphorylation in Lat–/– γδT cells pretreated or not with BAY61-3606 (10 μM). Graph shows the MFI relative to the nonstimulated control (n = 3). (G) Intracellular staining for IL-17A production in neonatal thymic γδT cells from WT mice (n = 3) and Lat–/– mice (n = 5) after stimulation with PMA and ionomycin. The number of IL-17A+ γδT cells (per mouse) is shown. All data represent the mean ± SEM. *P < 0.05 and **P < 0.01, by 2-way ANOVA (C, D, and F) and unpaired t test (G). Data represent 2 independent experiments (A, B, D, F, and G) or a single experiment (C and E).

