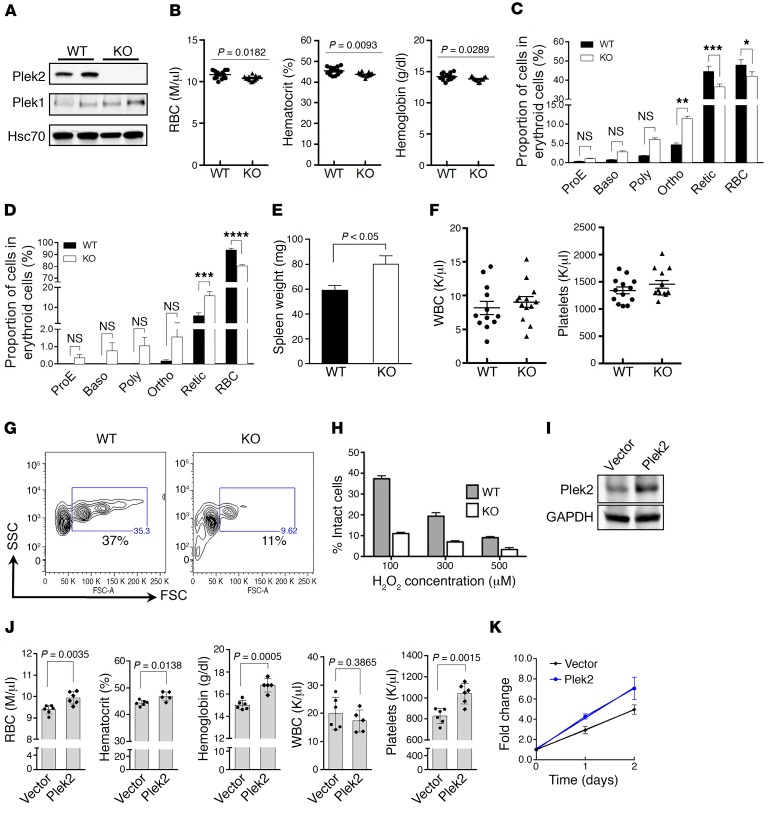
Figure 3. Plek2-knockout mice exhibit a mild anemia with aging.
(A) Western blot analysis of Plek2 and Plek1 of bone marrow mononuclear cells from the indicated mice. Hsc70 was used as a loading control. (B) RBC indices (in millions [M] of cells per μl) of indicated mice at 1 year old. N = 13/group. P value was determined by 2-tailed t test. (C and D) Quantification of different stages of erythroblasts by flow cytometric analyses from bone marrow (C) and spleen (D) of indicated mice at 1 year old. ProE, proerythroblasts; Baso, basophilic erythroblasts; Poly, polychromatic erythroblasts; Ortho, orthochromatic erythroblasts; Retic, reticulocytes. N = 5/group. *P < 0.05, **P< 0.01, ***P < 0.0005, and ****P < 0.0001; all P values were determined by 2-way ANOVA with Sidak’s multiple comparisons test. (E) Quantification of spleen weight of indicated mice at 1 year old. N = 5/group. P value was determined by 2-tailed t test. (F) Peripheral blood count of WBC (in thousands [K] of cells per μl) and platelets in indicated mice at 1 year old. (G) Flow cytometric assay of RBC from Plek2 wild-type and knockout mice treated with 100 μM H2O2 for 12 hours. The percentages of forward scatter–high (FSC-high) intact erythrocytes are presented. (H) Quantitative analysis of G at different concentrations of H2O2. (I) Western blot analysis of bone marrow cells from mice transplanted with Plek2-overexpressing bone marrow for 2 months. GAPDH was used as a loading control. (J) Complete blood count of mice transplanted with Plek2-overexpressing bone marrow for 2 months. P values were determined by 2-tailed t test. (K) Bone marrow lineage-negative cells from the indicated transplanted mice were purified and cultured in vitro in erythropoietin-containing medium. The cell numbers were counted at the indicated time. N = 3/group.

