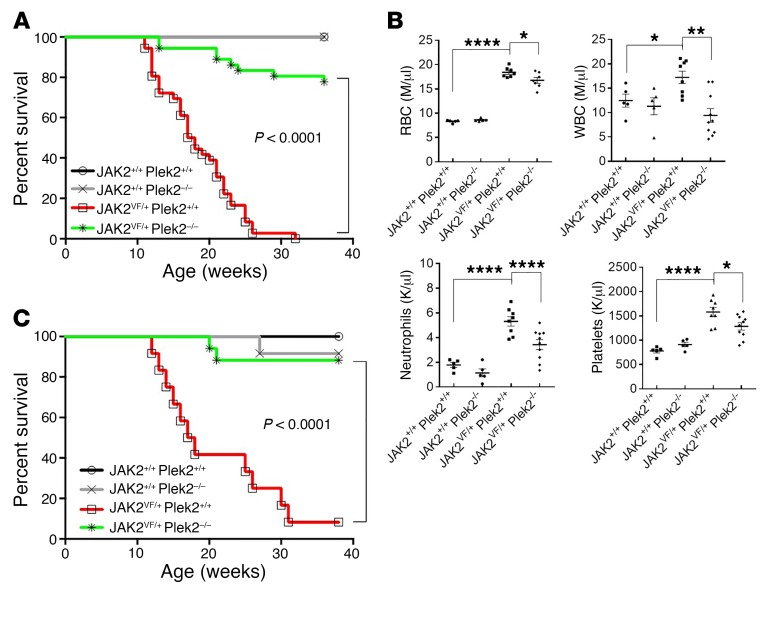
Figure 7. Loss of Plek2 rescues the lethality of the JAK2V617F-knockin mice.
(A) Kaplan-Meier survival analysis of indicated mice. Both males and females were included in each group. JAK2+/+ Plek2+/+ mice, N = 34; JAK2+/+ Plek2–/– mice, N = 34; JAK2VF/+ Plek2+/+ mice, N = 36; JAK2VF/+ Plek2–/– mice, N = 36. (B) Total bone marrow cells from the indicated mice (CD45.2+, 6 weeks old) were transplanted into lethally irradiated recipient mice (CD45.1+, 6 weeks old). Complete blood counts were performed 3 months after transplantation. Each data point represents 1 mouse. The data are shown as the mean ± SD. *P < 0.05, **P < 0.01, and ****P < 0.0001; all P values were determined by 1-way ANOVA with Tukey’s multiple comparisons test. M, millions; K, thousands. (C) Kaplan-Meier survival analysis of the transplanted mice. JAK2+/+ Plek2+/+ mice, N = 10; JAK2+/+ Plek2–/– mice, N = 10; JAK2VF/+ Plek2+/+ mice, N = 17; JAK2VF/+ Plek2–/– mice, N = 17.

