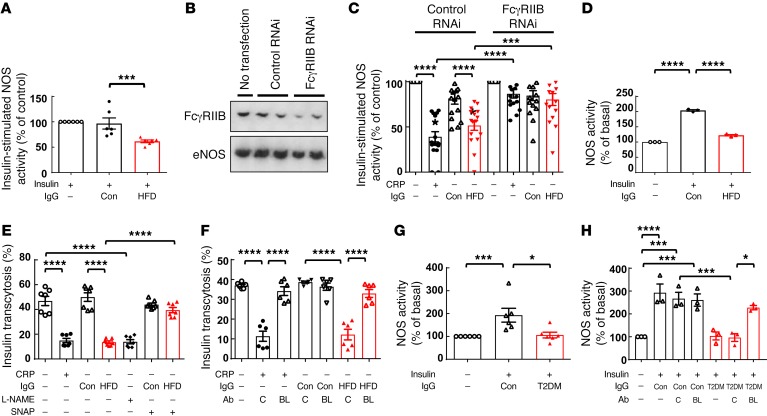
Figure 5. IgG from HFD-fed mice attenuates insulin-induced eNOS activation and transendothelial transport of insulin via FcγRIIB and eNOS antagonism, and IgG from T2DM subjects blunts insulin action in human endothelium via FcγRIIB.
(A) BAECs were preincubated for 30 minutes with IgG isolated from control diet–fed (Con-IgG) or HFD-fed (HFD-IgG, 10 μg/ml) mice, and eNOS activity stimulated by insulin (100 nM) was measured. n = 6. (B and C) BAECs were transfected with or without control RNAi or RNAi targeting FcγRIIB. Downregulation of FcγRIIB was assessed by immunoblotting (B) using anti-FcγRIIB or anti-eNOS antibody to evaluate protein loading. (C) Forty-eight hours after transfection, cells were pretreated with CRP (25 μg/ml), Con-IgG, or HFD-IgG (10 μg/ml) for thirty minutes, and eNOS activity stimulated by insulin was measured. n = 16. (D) HAECs were preincubated with Con-IgG or HFD-IgG (10 μg/ml), and eNOS activity under basal conditions or with insulin treatment was measured. n = 3. (E) Confluent HAEC monolayers on Transwells were preincubated for 30 minutes with CRP, Con-IgG, or HFD-IgG in the absence or presence of the NOS inhibitor L-NAME (2 mM) or the NO donor SNAP (100 nM). FITC-conjugated insulin (50 nM) was added to the upper chamber, and the amount of insulin transcytosed to the lower chamber was evaluated after 2 hours. n = 7. (F) Using the study design and methods described for E, endothelial cell insulin transcytosis was evaluated without versus with CRP, Con-IgG, or HFD-IgG treatment, in the presence of subtype-matched control antibody (C, 10 μg/ml) or the FcγRIIB-blocking antibody AT10 (BL, 10 μg/ml). n = 6. (G) Insulin-induced eNOS activation was evaluated in HAECs with or without treatment with IgG from nondiabetic individuals (Con) or T2DM patients. n = 6. (H) Additional NOS activity assays were performed in the presence of the subtype-matched control antibody (C) or the FcγRIIB-blocking antibody (BL). n = 3. Values represent the mean ± SEM. *P < 0.05, ***P < 0.005, and ****P < 0.001, by 1-way ANOVA with Tukey’s post-hoc test.

