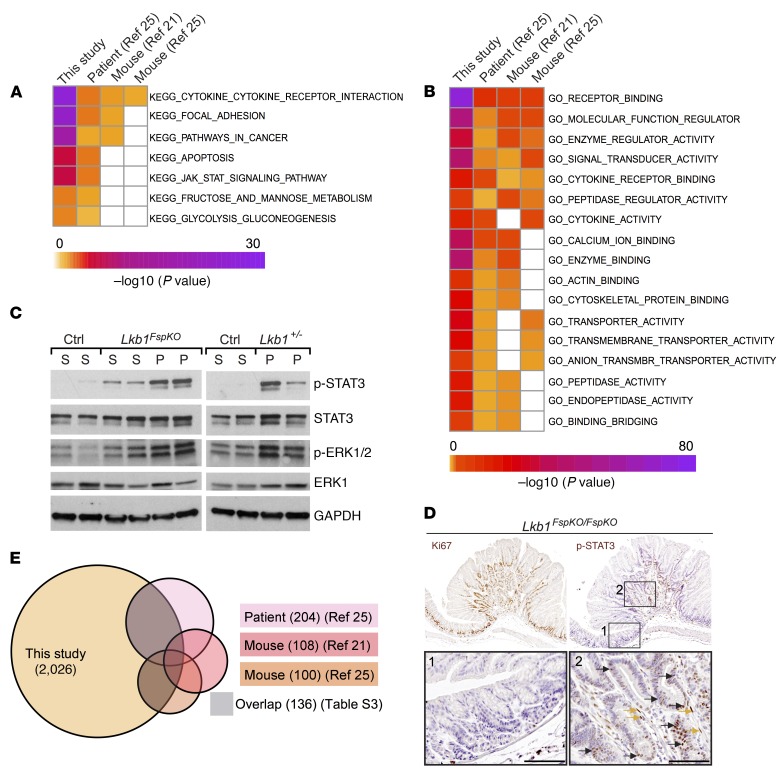
Figure 5. Activation of JAK/STAT3 in polyps.
(A and B) Heatmap of significantly overexpressed KEGG (A) and GO molecular function (B) signatures in our RNA-seq data set, shared with previously published PJS polyp Affymetrix data set and 2 Lkb1+/– mouse polyp Affymetrix data sets. (C) Western blot analysis of STAT3 (p-STAT3-Y705) and MAPK pathway (p-ERK1/2) activation in Lkb1FspKO/FspKO and Lkb1+/– polyps. (D) Representative immunohistochemical analysis of Ki67 and p-STAT3-Y705 in consecutive sections of an Lkb1FspKO/FspKO mouse gastric polyp. Yellow arrows, examples of stromal staining; black arrows, examples of epithelial staining. Scale bars: 100 μm. (E) Venn diagram of overexpressed genes identified in indicated experiments. Genes represented in the RNA-seq data set and at least one of the other data sets (21, 25) (136 genes) are listed in Supplemental Table 3.

