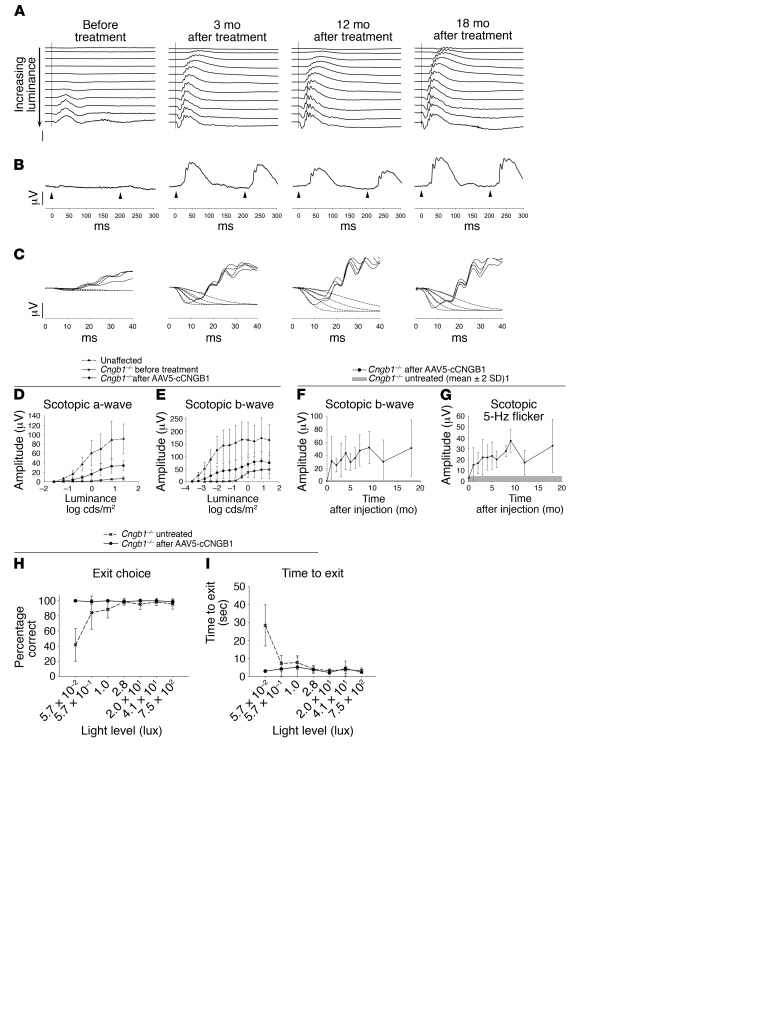
Figure 7. Sustained rescue of rod function by gene therapy.
(A–C) Scotopic ERGs before treatment and 3, 12, and 18 months after subretinal AAV5-hGRK1-cCngb1 treatment (dog 14-055 right eye). (A) Luminance response series. Note the obvious lowering of the response threshold and increased a- and b-wave amplitudes (stimulus luminances ranged from –3.7 to 0.4 log cds/m2). (B) Scotopic 5-Hz flicker responses at –1.6 log cds/m2 luminance (vertical scale bars: 50 μV; horizontal scale bars: 50 ms). (C) Fit of the leading edge of the dark-adapted a-wave to the Hood and Birch model. The solid lines are the raw ERG data and the dotted lines the derived fits to the leading edge of the a-wave. (D and E) Mean (± SD) stimulus response ERG plots for scotopic a- and b-waves comparing unaffected control dogs (n = 4) with Cngb1–/– dogs before and 3-months after subretinal AAV5-hGRK1-cCngb1 treatment (n = 7). Compared with before treatment, all mean a-wave responses were significantly improved (P < 0.05 and P < 0.01, 2-tailed, paired Student’s t test). The b-wave responses were also significantly improved (P < 0.05 to P <0.01, 2-tailed, paired Student’s t test), with the exception of the responses to the strongest stimuli (P = 0.052 and P = 0.054, 2-tailed, paired Student’s t test). (F and G) Duration of ERG rescue. Mean ± SD of scotopic b-wave in response to a stimulus of –2 log cds/m2 (F) and scotopic 5-Hz flicker at –1.6 log cds/m2 luminance (G), with time after injection. The gray bar represents the mean amplitude of untreated dogs ± 2 SD. Number of treated eyes at each time point: before treatment (0), 1, 2, and 3 months, n = 7;4 and 5 months, n = 4; 6, 7, and 9 months, n = 3; 12 and 18 months, n = 2. (H and I) Vision test results before versus 3 months after treatment. (H) Percentage of dogs that made the correct exit choice at each of 7 lighting levels. Pretreatment Cngb1–/– dogs made more exit choice errors at the dimmer light levels, and these dogs almost always chose correctly 3 months after gene augmentation. The improvement was significant at the lowest light intensity (P < 0.0001, 2-tailed, paired Student’s t test). (I) Time to exit. Prior to treatment, the Cngb1–/– dogs were slower to exit at the low light levels, and 3 months after treatment, the dogs were faster to exit at the low light levels. The difference was significant at the lowest light level (P < 0.001, 2-tailed, paired Student’s t test).

