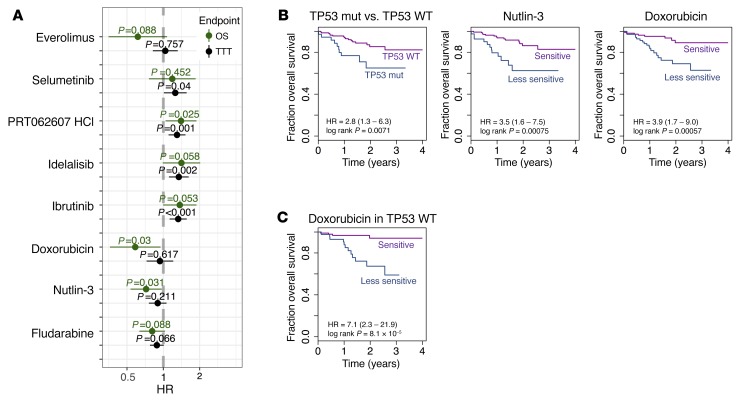
Figure 13. Ex vivo drug response and outcome.
(A) Association of drug responses with time from sampling to treatment (TTT; n = 174) and overall survival (OS; n = 184), assessed by univariate Cox regressions. Shown are estimated hazard ratios (HR) and 95% confidence intervals. The average viability values, across all 5 concentrations for fludarabine, doxorubicin, and nutlin-3, and across the 2 lowest concentrations 156 and 625 nM for the targeted drugs ibrutinib (BTK), idelalisib (PI3K), selumetinib (MEK), everolimus (mTOR), and PRT062607 (SYK), were scaled such that a unit change of the regressor corresponds to 10% change in cell viability. (B) Kaplan-Meier plots for OS stratified by TP53 mutation status, and nutlin-3 and doxorubicin response. Patient groups of nutlin-3 or doxorubicin responders and weak responders were defined by ex vivo drug responses dichotomized using maximally selected rank statistics to visualize effects. The same 172 CLL patient samples were used for all 3 Kaplan-Meier plots. Thirty-six patient samples were TP53 mutated, and 39 and 40 patient samples were in the nutlin-3 or doxorubicin weak-responder groups, respectively. (C) Analogous to the rightmost plot in panel B, but limited to patients with wild-type TP53.

