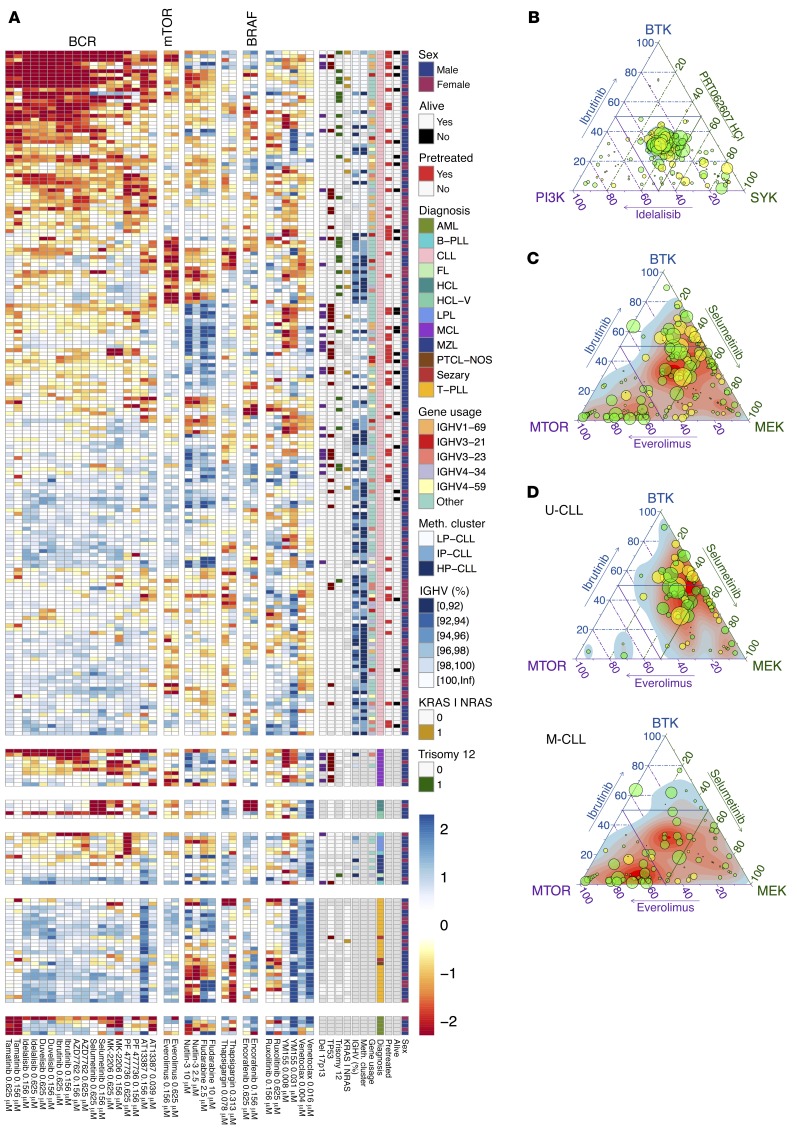
Figure 6. Functional classification of blood cancer based on drug perturbations.
(A) A global overview of the drug response landscape reveals heterogeneity within diseases and functionally defined disease subgroups. The heatmap matrix shows the viability measurements for 246 samples (rows) and 17 of the drugs at 2 concentrations each (columns). The data are shown on a Z-score scale, i.e., centered and scaled within each column. The color bars to the right show sample annotations. Prior to clustering, samples were divided into 6 disease groups, indicated by the horizontal gaps. A more detailed version of this plot is available in Supplemental Figure 8. (B) Relative effects of ibrutinib (BTK), idelalisib (PI3K), and PRT062607 (SYK) on each of the 184 CLL samples are shown in ternary plots. Given percentage viability values (vi) of 3 drugs compared, the relative effect of drug i is measured by (100 – vi)/(300 – [v1 + v2 + v3]), for i = 1, 2, and 3. Numbers per sample add up to 1 and correspond to positions within an equilateral triangle. The maximum of 100 – vi, as a measure of the overall susceptibility of the sample, is shown by dot size. Each drug is represented by the average of the 2 lowest concentrations. Response to the BCR inhibitors was similar in the majority of CLL samples. Prior treatment is indicated by dot color (green: pretreated, n = 52; yellow: untreated, n = 132). (C) In contrast, comparison of relative responses to ibrutinib, selumetinib, and everolimus revealed a heterogeneous response. (D) Same data as in panel C, but separately plotted for U- and M-CLL (n = 74 and n = 98, respectively). U-CLL showed predominant reliance on BTK and MEK signaling, whereas M-CLL showed a less BTK-dependent response pattern, with many cases of predominant MEK or mTOR sensitivity. FL, follicular lymphoma; HCL-V, hairy cell leukemia variant; hMNC, human mononuclear cell; LPL, lymphoplasmacytic lymphoma PTCL-NOS, peripheral T cell lymphoma not otherwise specified.

