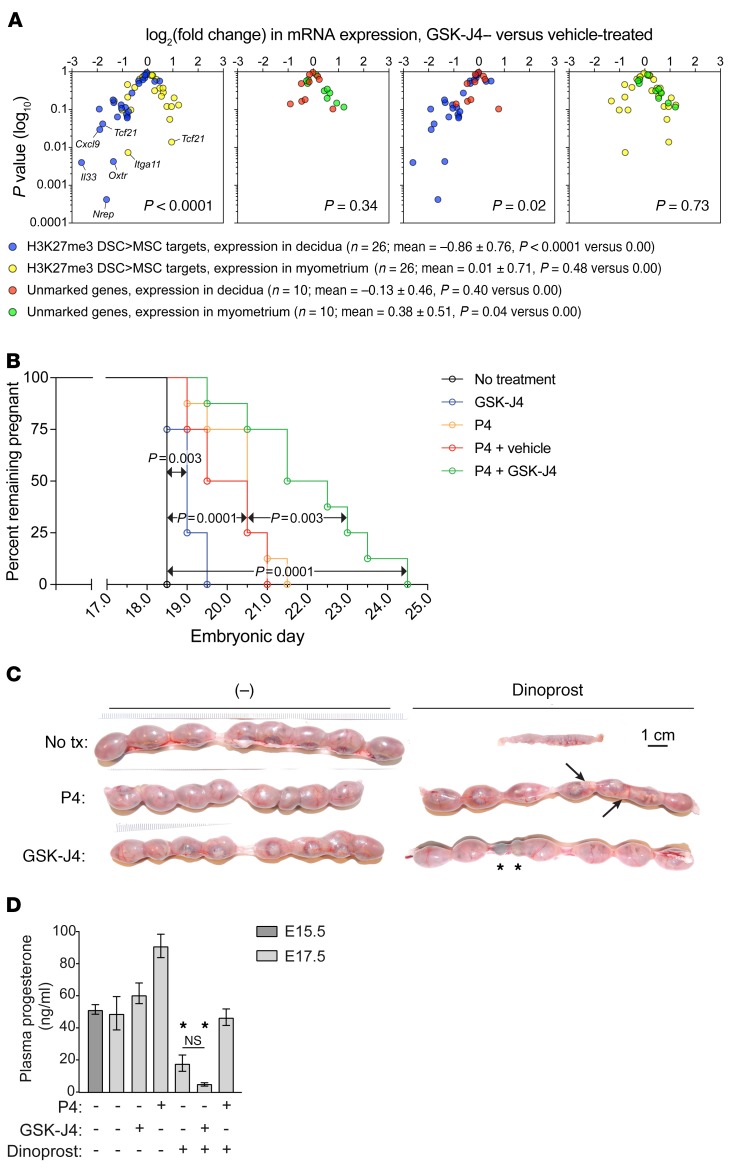
Figure 5. Effect of GSK-J4 on late-gestation pregnancy and parturition.
Mice were injected daily with GSK-J4 or vehicle starting on E13.5. (A) qRT-PCR analysis of mRNA expression in dissected decidual and myometrial tissue layers on E17.5, with log2(fold change) between GSK-J4– and vehicle-treated mice displayed on volcano plots (n = 6 mice/group). Genes affected by GSK-J4 (P < 0.05) are indicated. Supplemental Figure 7, A–C, shows individual gene-expression levels; the unmarked genes encode epigenetic modifiers, tissue layer–specific markers, and Pgr. The symbol key lists mean log2(fold change) ± SD for each group and the P value of its comparison to 0.00 by 1-sample t test. Groups were compared with each other by 1-way ANOVA (P < 0.0001) followed by Sidak’s multiple comparison test (P values shown in each plot). (B) Effects of GSK-J4 and P4 on delivery time (n = 8 mice/group); P values were determined by the log-rank (Mantel-Cox) test. (C) Effect of GSK-J4 on dinoprost-induced preterm delivery. Mice were injected with dinoprost and/or P4 on E16.5. Representative images from 6–8 mice/group. Injection of E16.5 pregnant mice with dinoprost unfailingly induced delivery within 24 hours (0/7 mice remained pregnant), 1 day before term. None of the delivered pups were viable. While P4 cotreatment prevented early delivery in all cases (6/6), only 27% of the fetuses were viable. Arrows indicate 2 pale, dead fetuses. In contrast, GSK-J4 cotreatment both prevented delivery (7/7 mice pregnant; P = 0.0006 compared with dinoprost alone, Fisher’s exact test) and maintained pup viability (86%; P < 0.0001 compared with dinoprost plus P4, Fisher’s exact test). Asterisks indicate implantation sites that had resorbed earlier in gestation. (D) Plasma P4 levels (mean ± SEM; n = 3 mice/group). GSK-J4/dinoprost–treated mice had low plasma P4 (P < 0.0001, 1-way ANOVA; *P < 0.0001) and thus had undergone luteolysis; presumably, they would soon enter labor. Supplemental Table 7 shows a full accounting of the experiments in panels B and C.

