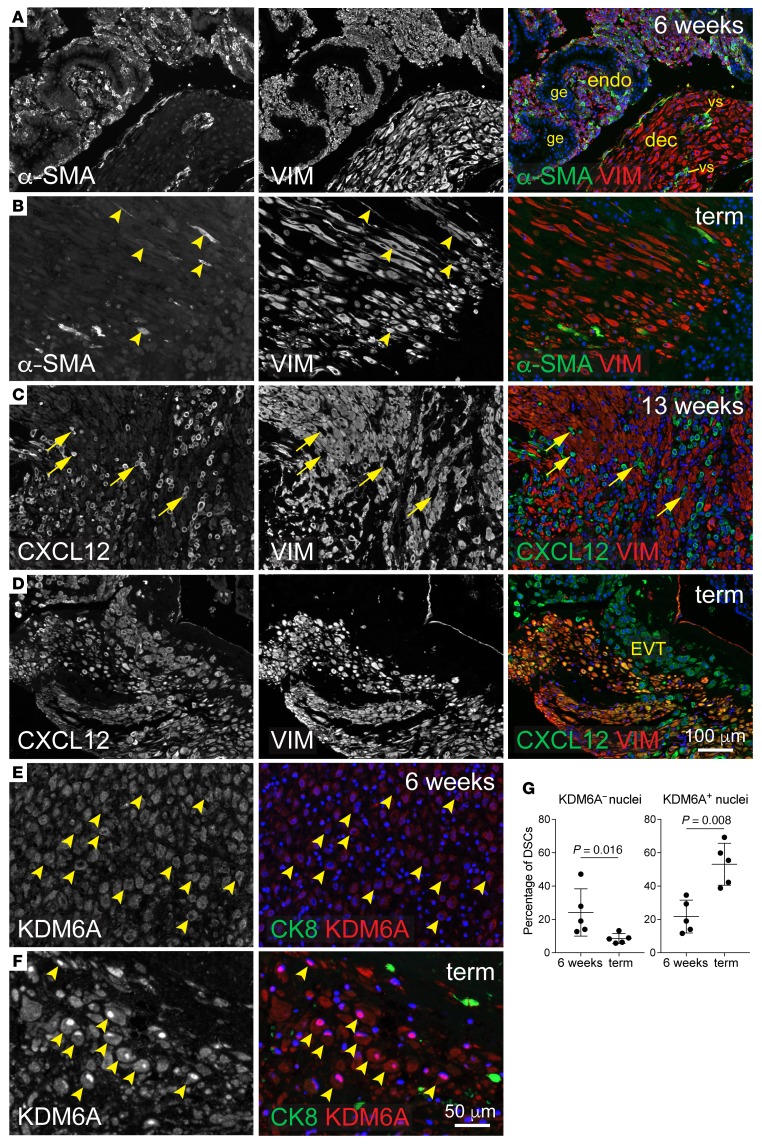
Figure 6. Expression of fibroblast activation markers and KDM6A in the pregnant human uterus.
Images are representative of 5 specimens per time point. Specimens at 6 and 13 weeks were from elective terminations. Vimentin (VIM) was used as an ESC/DSC marker. DAPI counterstain (blue). (A and B) α-SMA/VIM staining. At 6 weeks (A), fields of small VIM+ cells associated with extensive glandular epithelium (ge) identify areas of undecidualized endometrium. α-SMA+ cells within decidualized areas at 6 (A) and 13 weeks (Supplemental Figure 8B) were invariably associated with vascular structures (vs) and thus were vascular smooth muscle cells. (C and D) CXCL12/VIM staining. Note the absence of CXCL12 expression in DSCs at 13 weeks, which contrasts with interspersed CXCL12+VIM– cells (C, arrows). Neighboring sections revealed these VIM– cells to be positive for CK7 and CK8 (not shown and Supplemental Figure 8A), identifying them as extravillous trophoblasts (EVT) and confirming their expression of CXCL12 described previously (52). At term, all DSCs expressed substantial CXCL12 levels that were similar to those of neighboring trophoblasts (D). (E and F) KDM6A/CK8 staining; higher magnification. At 6 weeks, KDM6A staining in DSCs (identified morphologically and by their CK8 negativity) was frequently nonnuclear, whereas at term it was predominantly nuclear. Respective examples of both cases are indicated (arrowheads). Of note, we could not rule out the possibility that the cytoplasmic staining was nonspecific. If so, this would mean that the nuclear accumulation at term reflected new KDM6A synthesis; otherwise, it might in part reflect nuclear shuttling, as described previously for KDM6B (53). (G) Quantification of KDM6A distribution. Cells were scored as having KDM6A– or KDM6A+ nuclei based upon their nuclear-to-cytoplasmic staining ratio. n = 84–380 cells over at least 3 fields were scored per specimen. Error bars indicate SD. P values were determined by 2-tailed Mann-Whitney U test.

