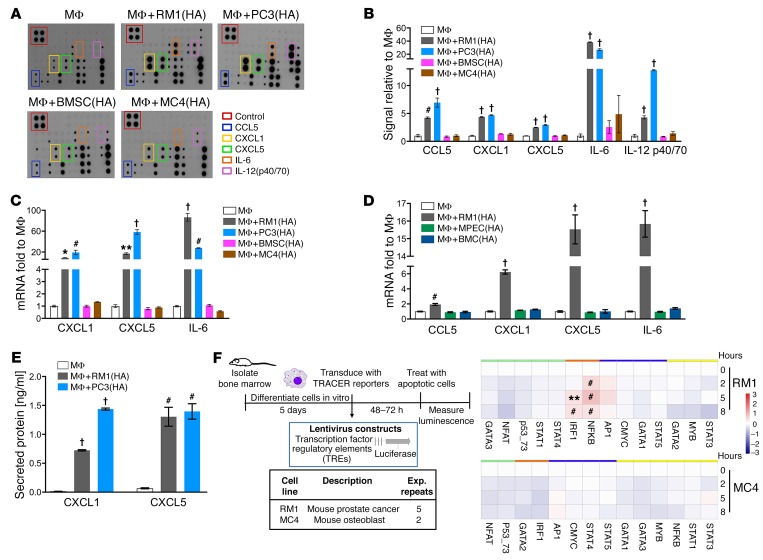
Figure 1. Inflammatory cytokine and transcription factor activation in cocultures of macrophages and highly apoptotic (HA) cells.
(A and B) Supernatants were collected from macrophages (MΦs) alone or cocultured with RM1(HA), PC3(HA), BMSC(HA), or MC4(HA) cells for 18–20 hours and analyzed via inflammatory cytokine array. (A) Representative images. (B) Quantification of cytokines induced. (C) mRNAs isolated from cocultures described in A were analyzed by quantitative PCR (qPCR). (D) mRNAs isolated from MΦs alone or cocultured with RM1(HA), MPEC(HA), or BMC(HA) were analyzed by qPCR for indicated genes. (E) ELISA for total CXCL1 and CXCL5 levels in supernatants of MΦs alone or cocultured with RM1(HA) or PC3(HA). (F) Transcriptional activity cell arrays (TRACER). Analysis of bone marrow–derived MΦs transfected with transcription factor (TF) reporter constructs and cocultured with RM1(HA) or MC4(HA) cells. Data from experimental repeats (n = 5 and n = 2 independent experiments for RM1 for MC4, respectively) were combined. Measurements were log2-transformed and normalized to average intensity of control reporter and then to background. Finally, data were normalized to the initial reporter measurement for each treatment condition at 0 hours. Heatmaps show TF grouping according to cluster analysis for each cell line and the statistical significance, **P < 0.01, #P < 0.001, determined using limma package. Data in B–E are mean ± SEM, n = 3 per group; *P < 0.05, **P < 0.01, #P < 0.001, †P < 0.0001 (1-way ANOVA).

