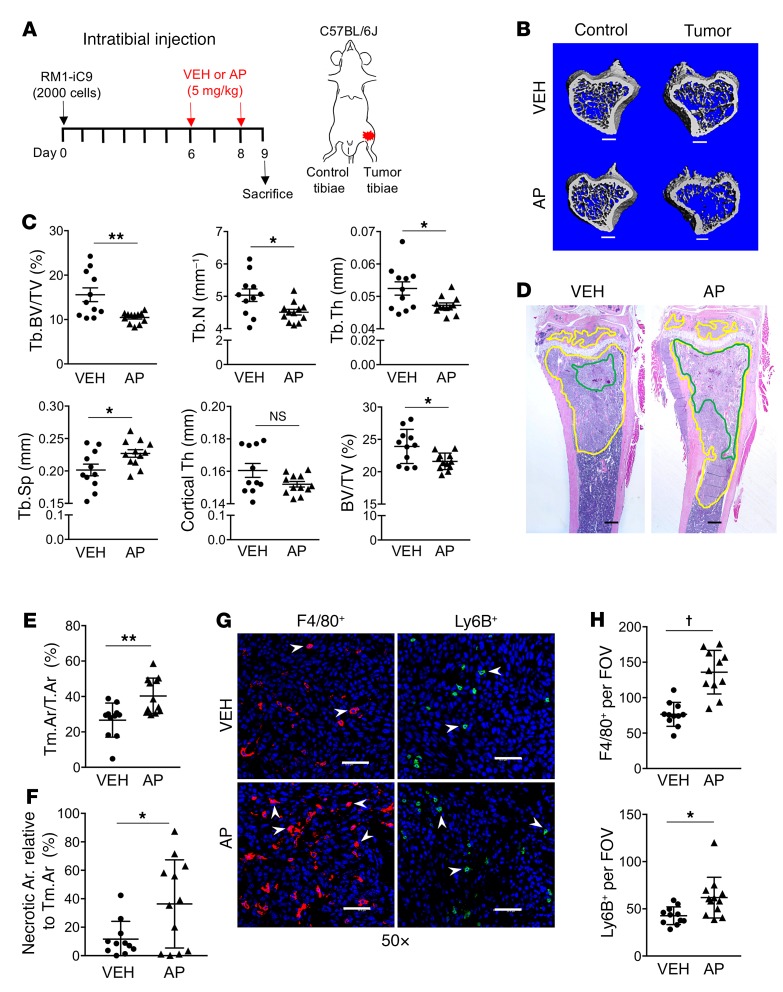
Figure 10. Cancer cell death induces accelerated tumor growth and bone osteolysis in the intratibial tumor model.
(A) Experimental schematic. Mice injected with RM1-iC9 cells were randomized before VEH or AP treatment. (B) Representative μCT images showing trabecular bone in VEH and AP cancer-inoculated tibiae and the corresponding contralateral controls (nontumor) (scale bars: 400 μm). (C) Bone parameters quantified by μCT: trabecular bone volume relative to total volume (Tb.BV/TV), trabecular number (Tb.N), trabecular thickness (Tb.Th), trabecular spacing (Tb.Sp), cortical thickness (Cortical Th), and total bone volume relative to total volume (BV/TV); VEH (n = 11) and AP (n = 12). (D) Representative images of H&E sections of tumor-inoculated VEH and AP tibiae. Tumor areas are highlighted in yellow and necrosis in green (scale bars: 400 μm). (E) Quantification of tumor area relative to total bone area (Tm.Ar/T.Ar). (F) Necrotic area relative to tumor area inside the bone. (G) Images inside the tumor areas of sections stained using F4/80 and Ly6B antibodies for VEH and AP (×50) (scale bars: 200 μm). (H) Quantification of F4/80+ (n = 11 per group) and Ly6B+ VEH (n = 11) and AP (n = 12) staining (3 fields inside tumor area at ×20 per sample). Data are mean ± SEM; *P < 0.05, **P < 0.01, †P < 0.0001 (2-tailed Student’s t test).

