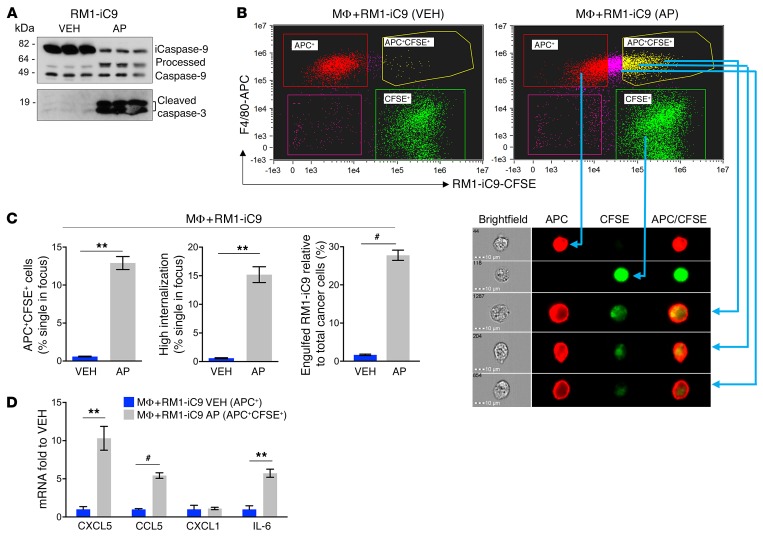
Figure 2. Efferocytosis of apoptosis-inducible prostate cancer RM1-iC9 cells.
(A) Apoptosis-inducible RM1-iC9 cells were treated with VEH or AP and analyzed by Western blot for the activation of inducible caspase-9 (iC9) and apoptosis-associated caspase-3. AP treatment increased processed caspase-9 and cleaved caspase-3, reflecting apoptosis (see complete unedited blots in the supplemental material). (B) Bone marrow MΦs were cocultured with RM1-iC9 cells stained with Cell Trace–CFSE (Invitrogen), and treated with VEH or AP for 18 hours. The cocultures were stained with F4/80-APC antibody and analyzed by flow cytometry. Representative FACS images from ImageStream showing MΦs alone (APC+, red gate), RM1-iC9 alone (CFSE+, green gate), and 3 different examples of MΦs engulfing RM1-iC9 (APC+CFSE+, yellow gate). (C) Bar graphs indicating the percentage of efferocytic MΦs (APC+CFSE+ cells), MΦs with high internalization of RM1-iC9, and engulfed RM1-iC9 (APC+CFSE+) relative to total cancer cells (CFSE+ plus APC+CFSE+) after treatment with VEH or AP. (D) mRNAs isolated from APC+CFSE+ gated cells (efferocytic MΦs) of MΦ+RM1-iC9(AP) and APC+ gated cells (nonefferocytic MΦs) of MΦ+RM1-iC9 (VEH) samples were analyzed by qPCR for selected genes. Fold changes were expressed relative to the nonefferocytic MΦ values (VEH). Data in C and D are mean ± SEM, n = 3 per group; **P < 0.01, #P < 0.001 (2-tailed Student’s t test).

