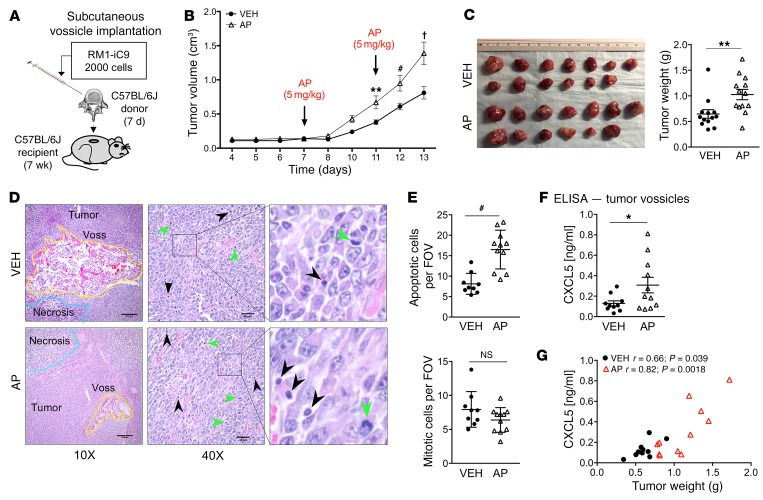
Figure 4. In vivo syngeneic osseous implant tumor model.
Vertebral bodies (vossicles) from C57BL/6J donor mice (7-day-old males) were inoculated with RM1-iC9 cells, and subcutaneously implanted in C57BL/6J recipient mice (7-week-old males). Mice were randomly divided in 2 groups and treated with VEH or AP to induce apoptosis in RM1-iC9 cells. (A) Experimental design for tumor vossicle model. (B) Tumor volumes were measured by caliper every 1–2 days starting at day 4. RM1-iC9 tumor vossicle volumes were compared between VEH and AP; n = 13 per group. Data are mean ± SEM; **P < 0.01, #P < 0.001, †P < 0.0001 vs. VEH (2-way ANOVA). (C) Images of RM1-iC9 VEH- and AP-treated tumor vossicles. Tumor weight (g) was measured at sacrifice, 13 days after implantation; n = 13 per group. (D) Representative H&E images of tumor vossicles showing vossicle fragments surrounded by tumor cells at ×10 (scale bars: 200 μm) and ×40 (scale bars: 40 μm) original magnifications. Areas of necrosis are highlighted by blue lines in the ×10 images. Apoptotic (black arrowheads) and mitotic cells (green arrowheads) are indicated at ×40 original magnification. (E) Apoptotic and mitotic cells were quantified (by a trained pathologist) inside non-necrotic tumor areas (5 fields at ×20 per tumor vossicle sample); VEH (n = 9) and AP (n = 11). (F) CXCL5 ELISA analysis of total protein lysates from VEH- (n = 10) and AP-treated (n = 11) tumor vossicles. (G) Graphs depicting the correlation between CXCL5 protein (determined by ELISA) and tumor weight. The Pearson correlation coefficient (r) and P values are indicated. Data in C, E, and F are mean ± SEM; *P < 0.05, **P < 0.01, #P < 0.001 (2-tailed Student’s t test).

