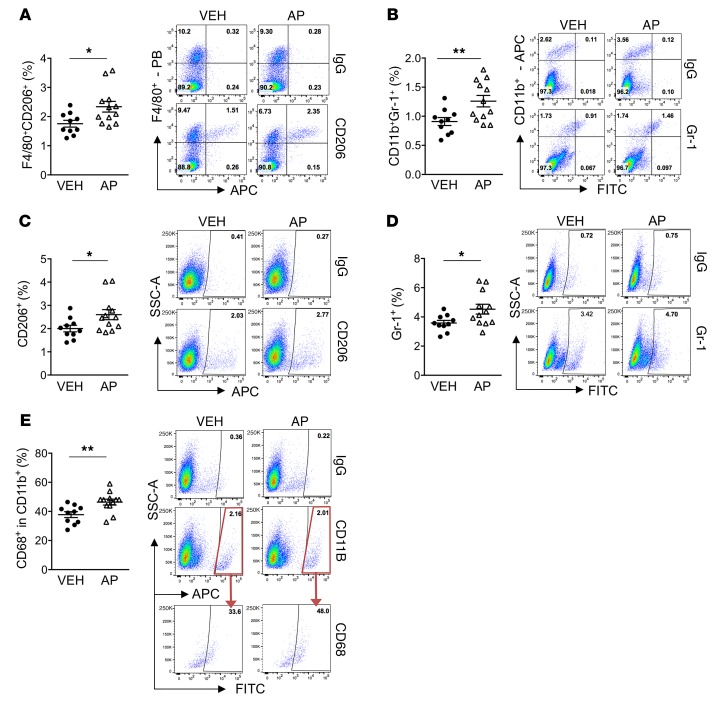
Figure 5. Increased tumor-accelerating myeloid inflammatory cells in AP-treated tumor vossicles.
Thirteen days after vossicle implantation, tumor cell populations were analyzed by flow cytometry in VEH (n = 10) and AP (n = 12) groups. Gates were established according to IgG isotype controls for each antibody. Graphs and representative plots are shown for each group. (A–E) Tumor populations of F4/80+CD206+ cells (A), CD11b+Gr-1+ cells (B), CD206+ cells (C), Gr-1+ cells (D), and CD68+ fraction in CD11b+ cells (E). PB, Pacific Blue (Bio-Rad). Data represent the mean ± SEM; *P < 0.05, **P < 0.01 (2-tailed Student’s t test). Additional flow results are shown in Supplemental Figure 3A.

