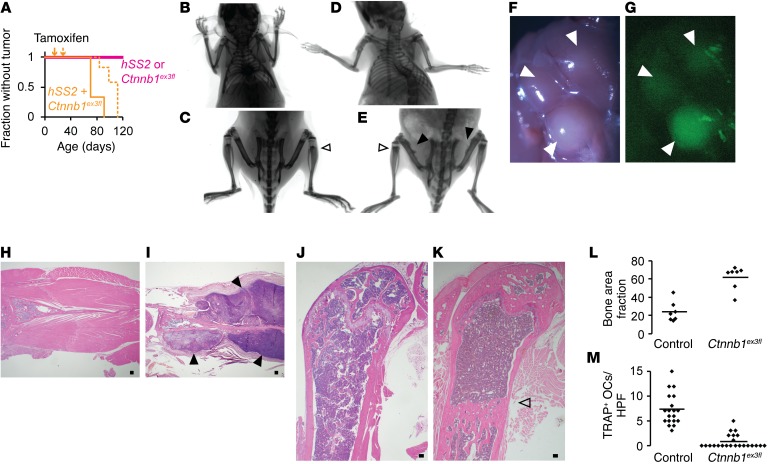
Figure 9. β-Catenin stabilization enables synovial sarcomagenesis from preosteoblasts.
(A) Kaplan-Meier plot of tumorigenesis among OsxCreERT mice bearing hSS2, Ctnnb1ex3fl, or both and that received tamoxifen at 2 weeks of age (solid line; n = 7; log rank test vs. control Z score = 3.15 and P =0.0016) or 4 weeks of age (dotted line; n = 7; Z score = 3.85 and P < 0.001). (B and C) Posteroanterior radiographs of OsxCreERT Ctnnb1ex3fl mice at 12 months of age, showing increased skeletal density, especially in apparently residual primary spongiosal regions, now in the metadiaphysis (open arrowhead). (D and E) OsxCreERT hSS2 Ctnnb1ex3fl mice at age 12 weeks of age with the same findings (open arrowhead) plus periosteal reactive bone and soft-tissue shadows (solid black arrowheads). (F) Gross dissection and (G) GFP fluorescence images show multiple periscapular tumors (solid black arrowheads) in a 12-week-old OsxCreERT hSS2 Ctnnb1ex3fl mouse. (H) Scapular H&E photomicrographs from a control mouse and (I) a OsxCreERT hSS2 Ctnnb1ex3fl mouse, the latter showing tumors (solid black arrowheads). (J) Photomicrographs of H&E staining of femur sagittal sections from a control mouse and (K) a OsxCreERT Ctnnb1ex3fl mouse, the latter showing dense, unremodeled primary spongiosa (open arrowhead). (L) Graph of fractions of trabecular bone area in metaphyseal femora from 12-week-old OsxCreERT Ctnnb1ex3fl/WT or Ctnnb1WT/WT mice (bars depict the mean; n = 7 femora; P < 0.0001, by 2-tailed Student’s t test). (M) Graph of TRAP+ osteoclasts (OCs) per high-power field (HPF) (bars depict the mean; n = 4 femora per group and ≥5 areas counted per femur; P < 0.0001, by 2-tailed Student’s t test). Scale bars: 100 um.

