Figure 5.
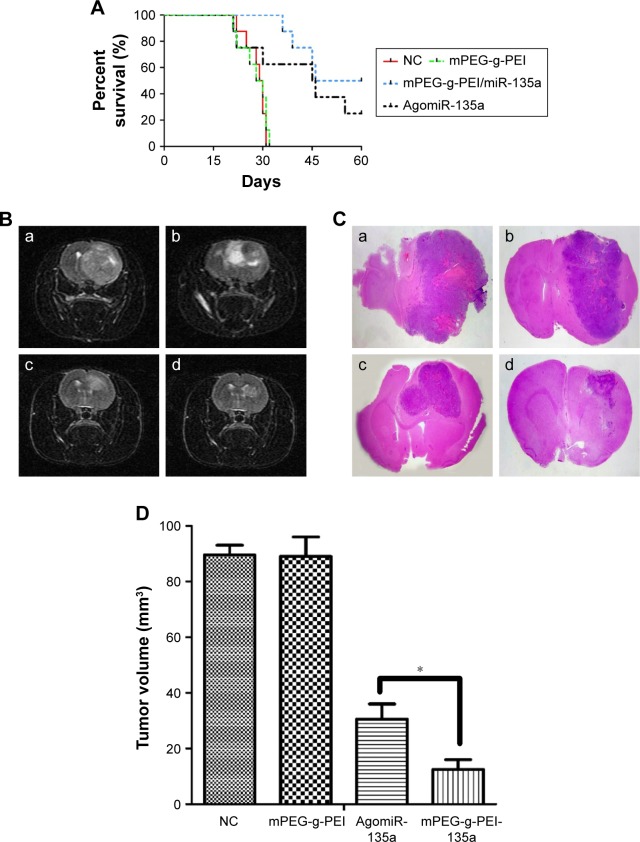
(A) Kaplan–Meier survival curves of miR-135a treatment in C6 rat models (n=8 for each group). (B) MRI on day 28 post-inoculation: (a) blank control group, (b) negative control group, (c) AgomiR-135a group, and (d) mPEG-g-PEI/miR-135a group. (C) H&E staining of brain sections in different groups: (a) blank control group, (b) negative control group, (c) Agomir-135a group, and (d) mPEG-g-PEI/miR-135a group. (D) The average tumor volume in different groups on day 28 post-inoculation (*P<0.05).
Abbreviations: MIR, magnetic resonance imaging; H&E, hematoxylin and eosin; mPEG-g-PEI, polyethylene glycol methyl ether grafted polyethylenimine; NC, negative control.

