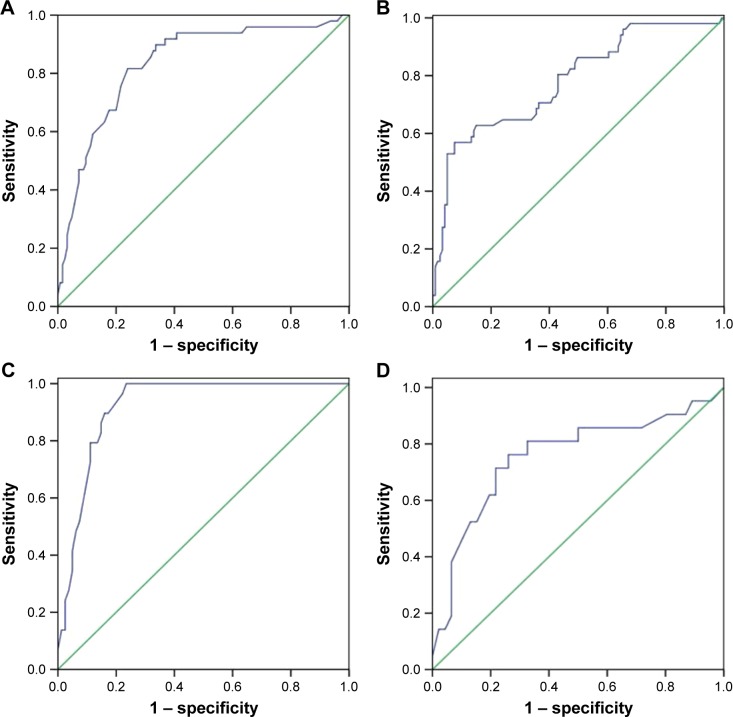
Figure 2.
ROC curve analysis for SUA and Tbil used for the assessment of IPSD in the first 3 months post-stroke. (A) SUA levels, (B) Tbil levels, (C) SUA levels in males, and (D) SUA levels in females.
Abbreviations: IPSD, postischemic stroke depression; ROC, receiver operating characteristic; SUA, serum uric acid; Tbil, total bilirubin.

