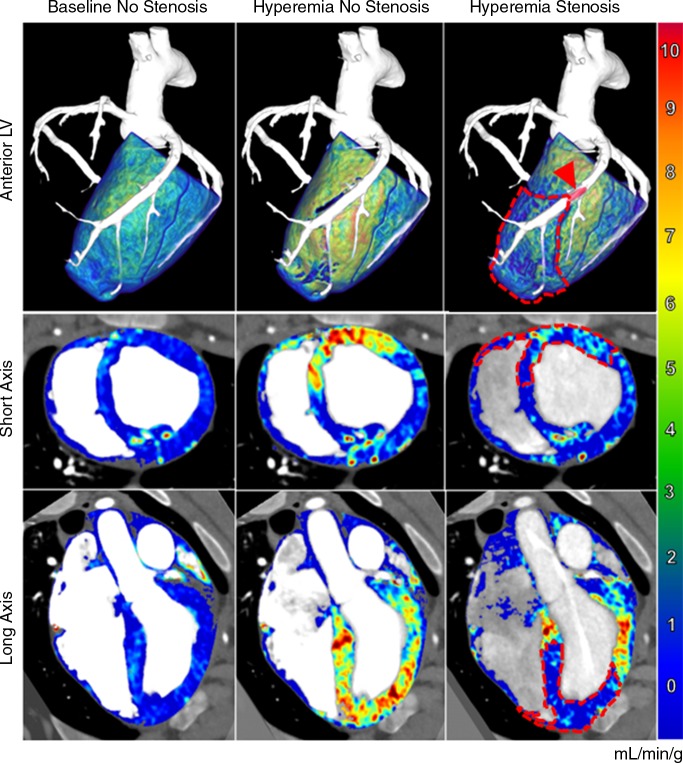
Figure 5:
Combined angiography and perfusion maps generated with the FPA technique. Several perfusion conditions were induced in the LAD coronary artery, including baseline perfusion with no stenosis (left), hyperemic perfusion with no stenosis (middle), and hyperemic perfusion in the presence of significant stenosis (right). Top: Anterior volumetric views of the left ventricle (LV ) are shown for three-dimensional visualization of the balloon stenosis position (arrowhead) and distal perfusion deficit (dashed line). Axial (middle row) and coronal (bottom row) views of both ventricles are also displayed. The color bar indicates quantitative perfusion in milliliters per minute per gram.

