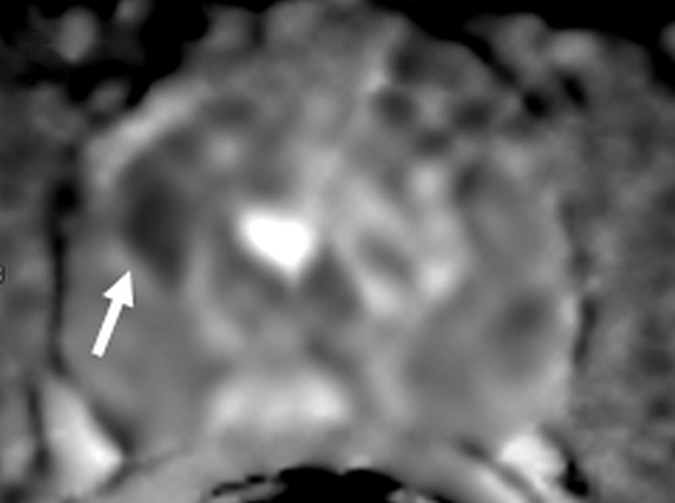
Figure 4b:

Images in a 55-year-old biopsy-naïve patient with a PSA level of 7.07 ng/mL. (a) Axial T2-weighted MR image shows an area of low signal intensity (arrow) in the right anterior transition zone. (b) Axial ADC map obtained reveals a hypointense lesion (arrow) in the same location. (c) DW MR image (b = 2000 sec/mm2 ) shows the lesion (arrow) as a hyperintense focus. (d) Dynamic contrast-enhanced MR image shows an early focal hyperenhancing lesion (arrow) in the right anterior transition zone. (e) Whole-mount pathologic specimen obtained at robotic-assisted prostatectomy shows Gleason 3+4 disease (red outline). The extent of the lesion is considerably larger than what was predicted at initial MR imaging.
