
Figure 3.
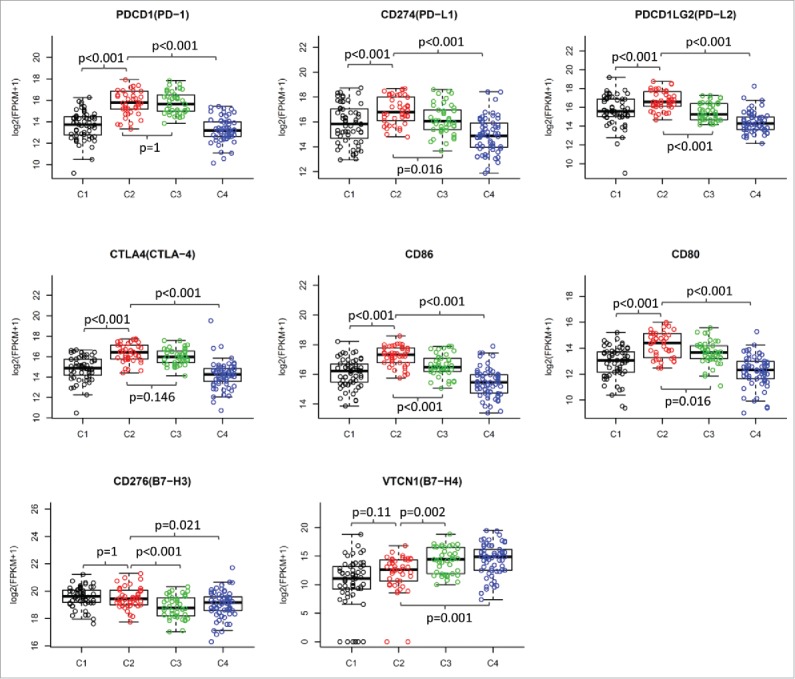
Differential expression of checkpoint molecules in HNSCC subtypes in TCGA cohort. The gene expression value of eight checkpoint molecules were presented across four subtypes. Boxplots indicate 5%, 25%, 50%, 75%, and 95%, respectively. Comparisons between subtypes were performed by Student t-test. All p values were corrected by the Bonferroni method. The adjusted value of p < 0.05 was considered significant.